Remote Demo Dataset
The following guide assumes you have deployed ClickStack using the instructions for the all-in-one image, or Local Mode Only and completed initial user creation.
This getting started guide uses a dataset available on the demo server that users can access when first deploying HyperDX. The dataset is hosted on the public ClickHouse instance at sql.clickhouse.com.
It contains approximately 40 hours of data captured from the ClickHouse version of the official OpenTelemetry (OTel) demo. The data is replayed nightly with timestamps adjusted to the current time window, allowing users to explore system behavior using HyperDX's integrated logs, traces, and metrics.
Because the dataset is replayed from midnight each day, the exact visualizations may vary depending on when you explore the demo.
Demo scenario
In this demo, we investigate an incident involving an e-commerce website that sells telescopes and related accessories.
The customer support team has reported that users are experiencing issues completing payments at checkout. The issue has been escalated to the Site Reliability Engineering (SRE) team for investigation.
Using HyperDX, the SRE team will analyze logs, traces, and metrics to diagnose and resolve the issue—then review session data to confirm whether their conclusions align with actual user behavior.
Demo architecture
This demo reuses the official OpenTelemetry demo. This is composed of microservices written in different programming languages that talk to each other over gRPC and HTTP and a load generator that uses Locust to fake user traffic.
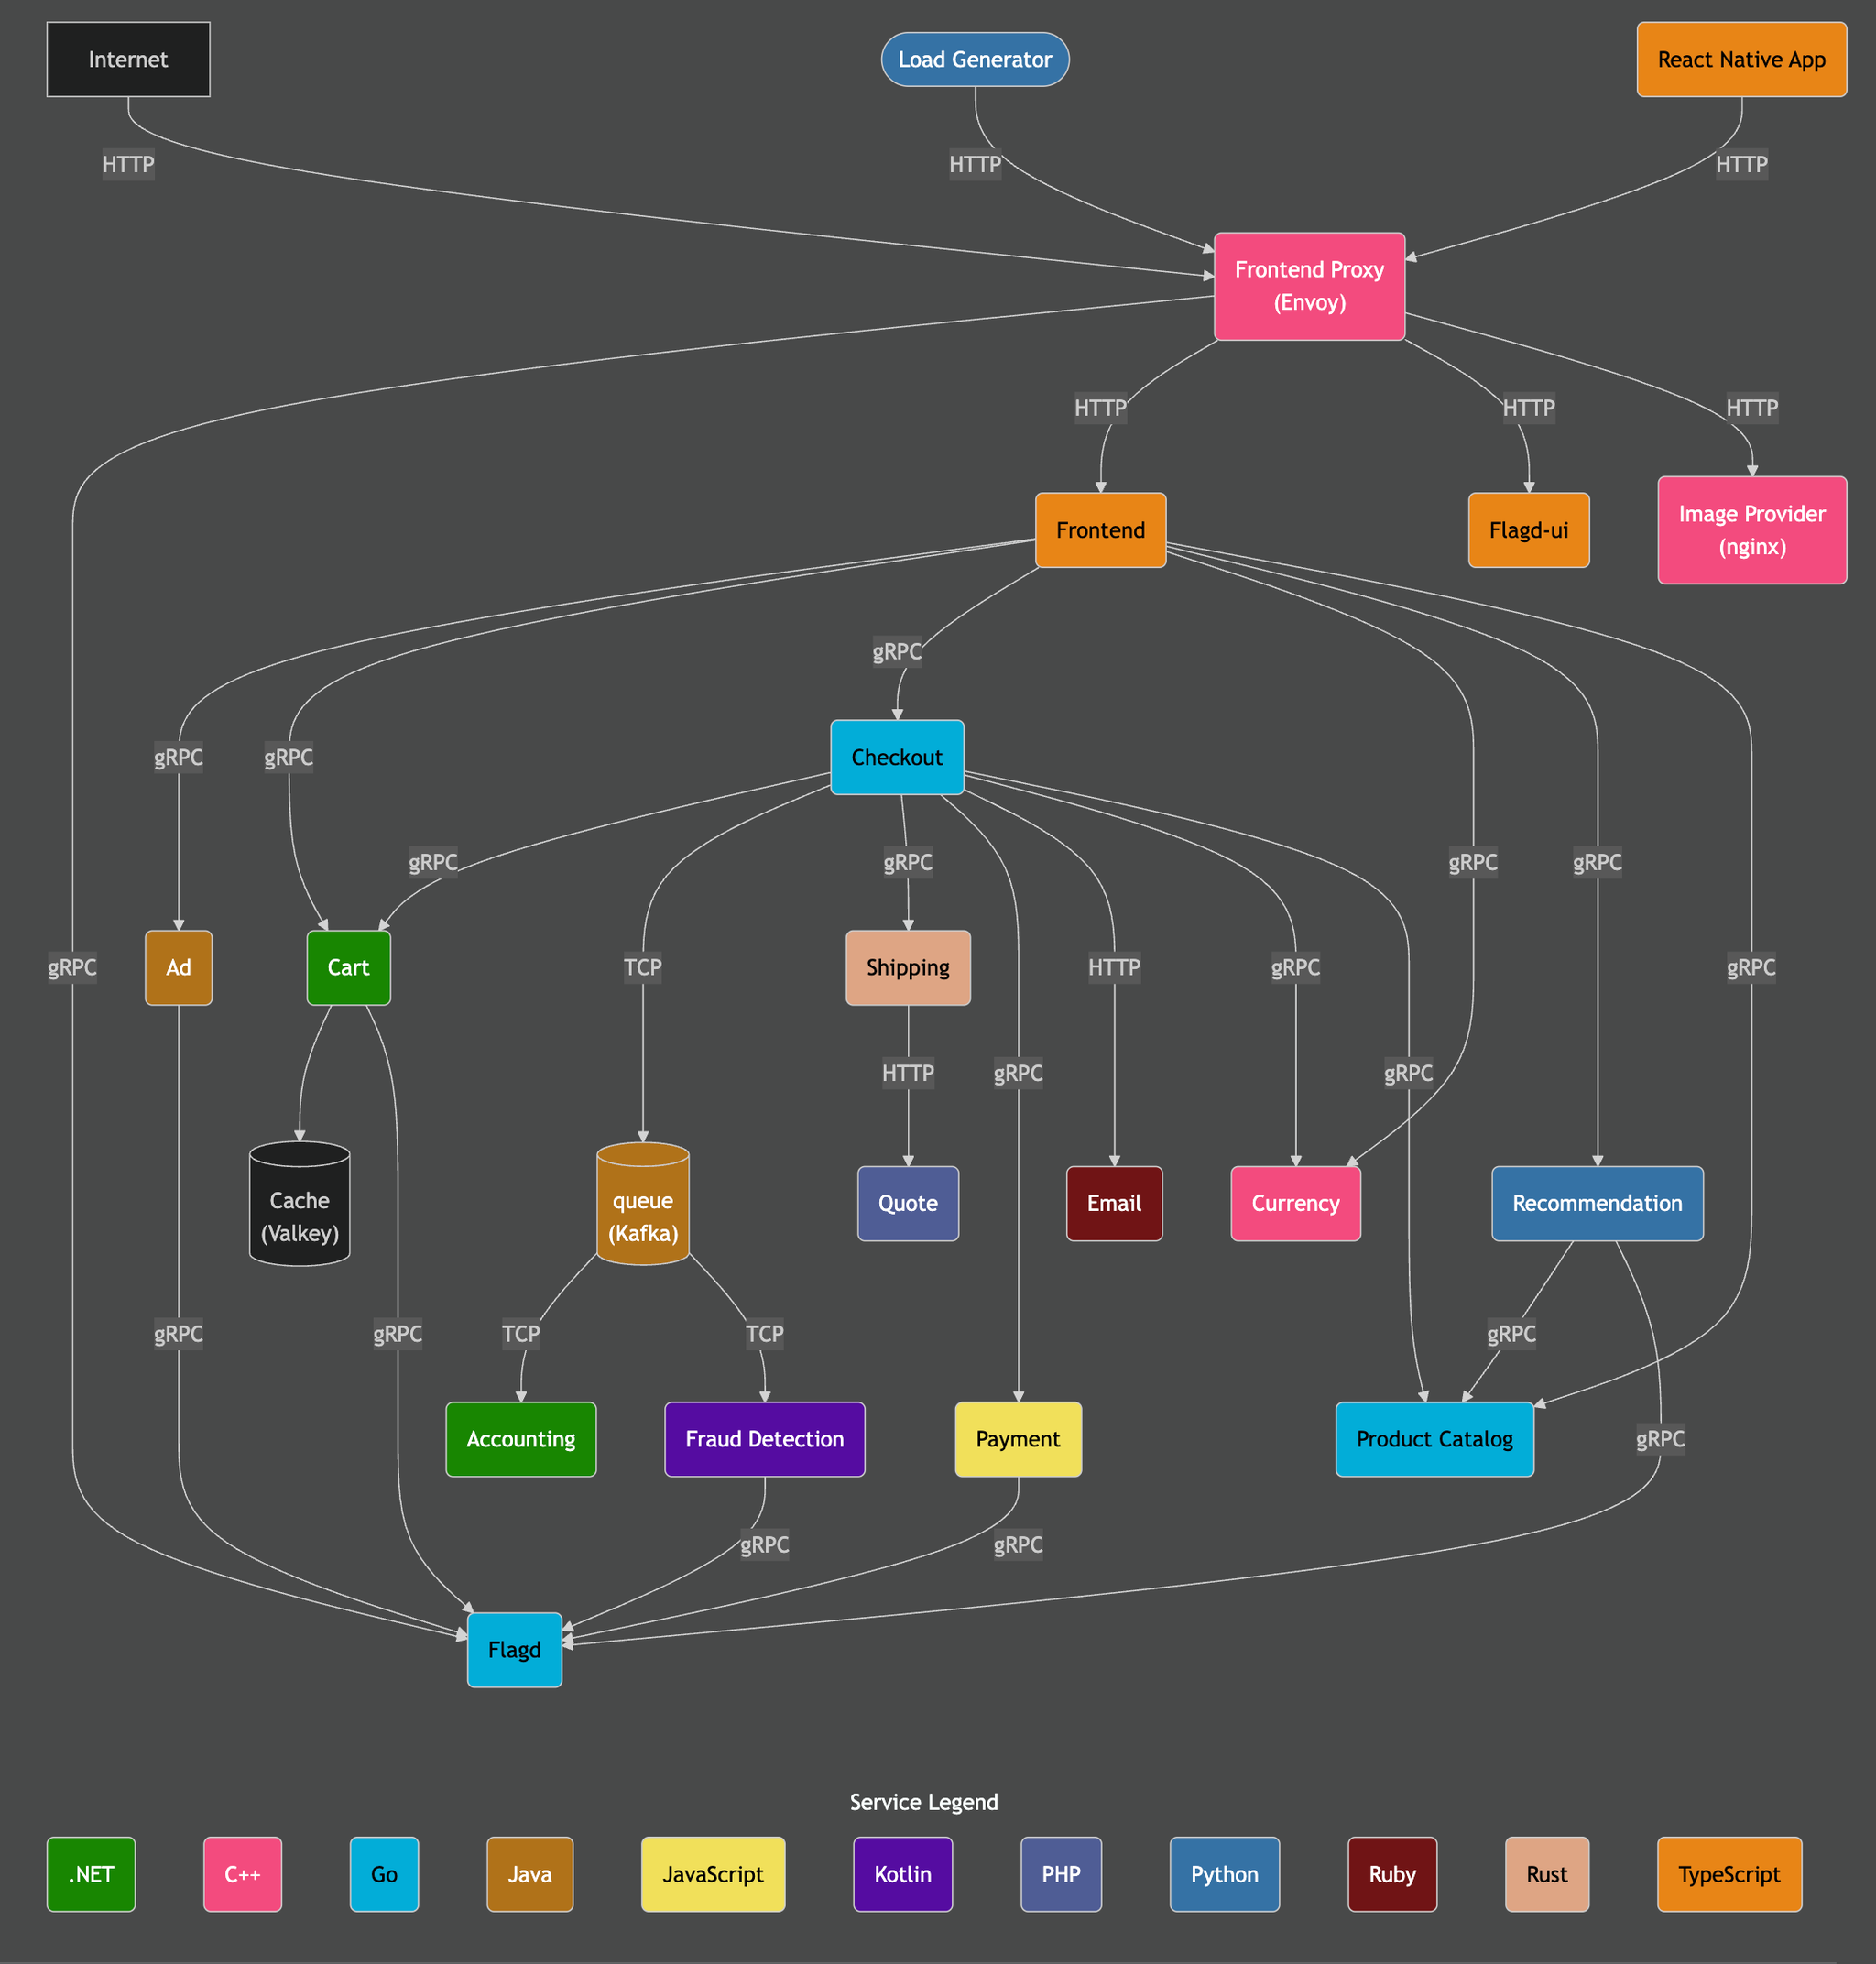
Credit: https://opentelemetry.io/docs/demo/architecture/
Further details on the demo can be found in the official OpenTelemetry documentation.
Demo steps
We have instrumented this demo with ClickStack SDKs, deploying the services in Kubernetes, from which metrics and logs have also been collected.
This step can be skipped if you clicked Connect to Demo Server when deploying in Local Mode. If using this mode, sources will be prefixed with Demo_ e.g. Demo_Logs
Navigate to Team Settings and click Edit for the Local Connection:
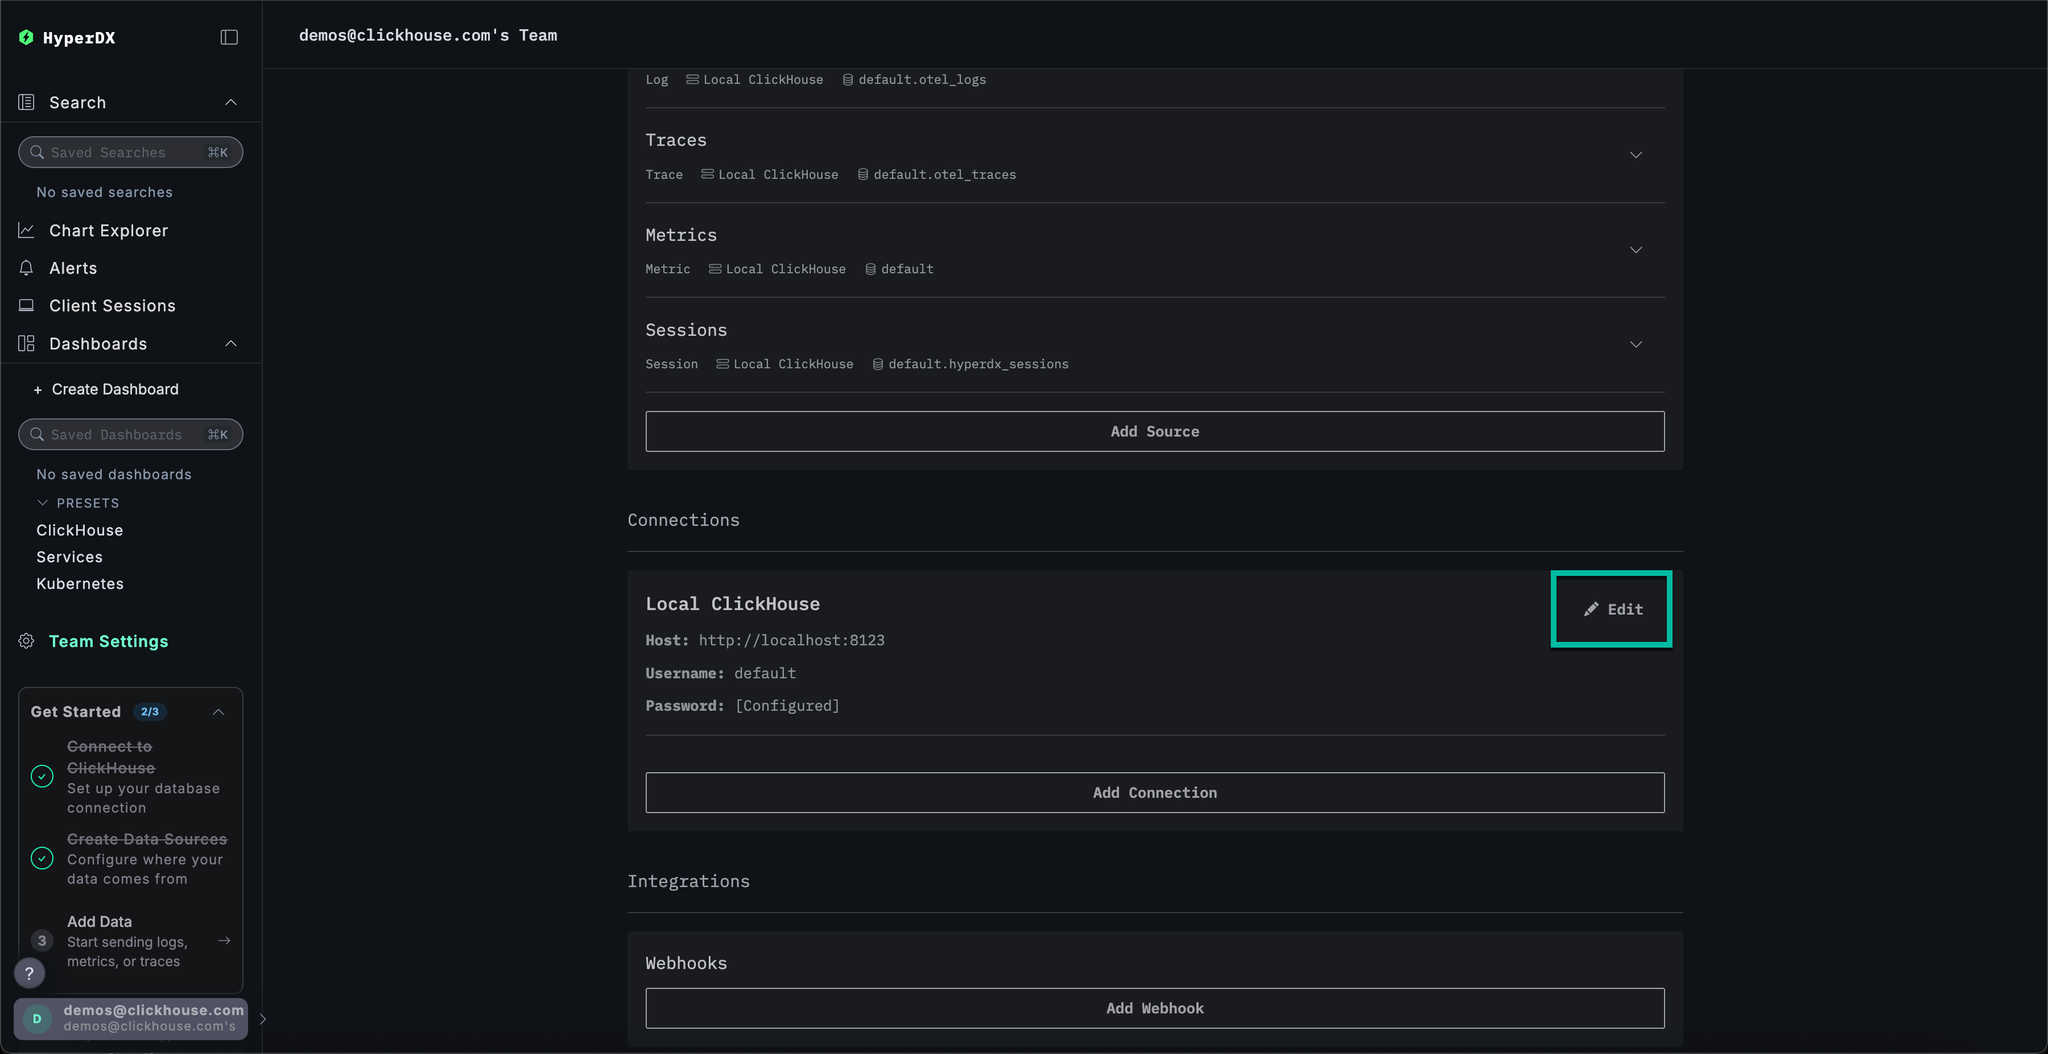
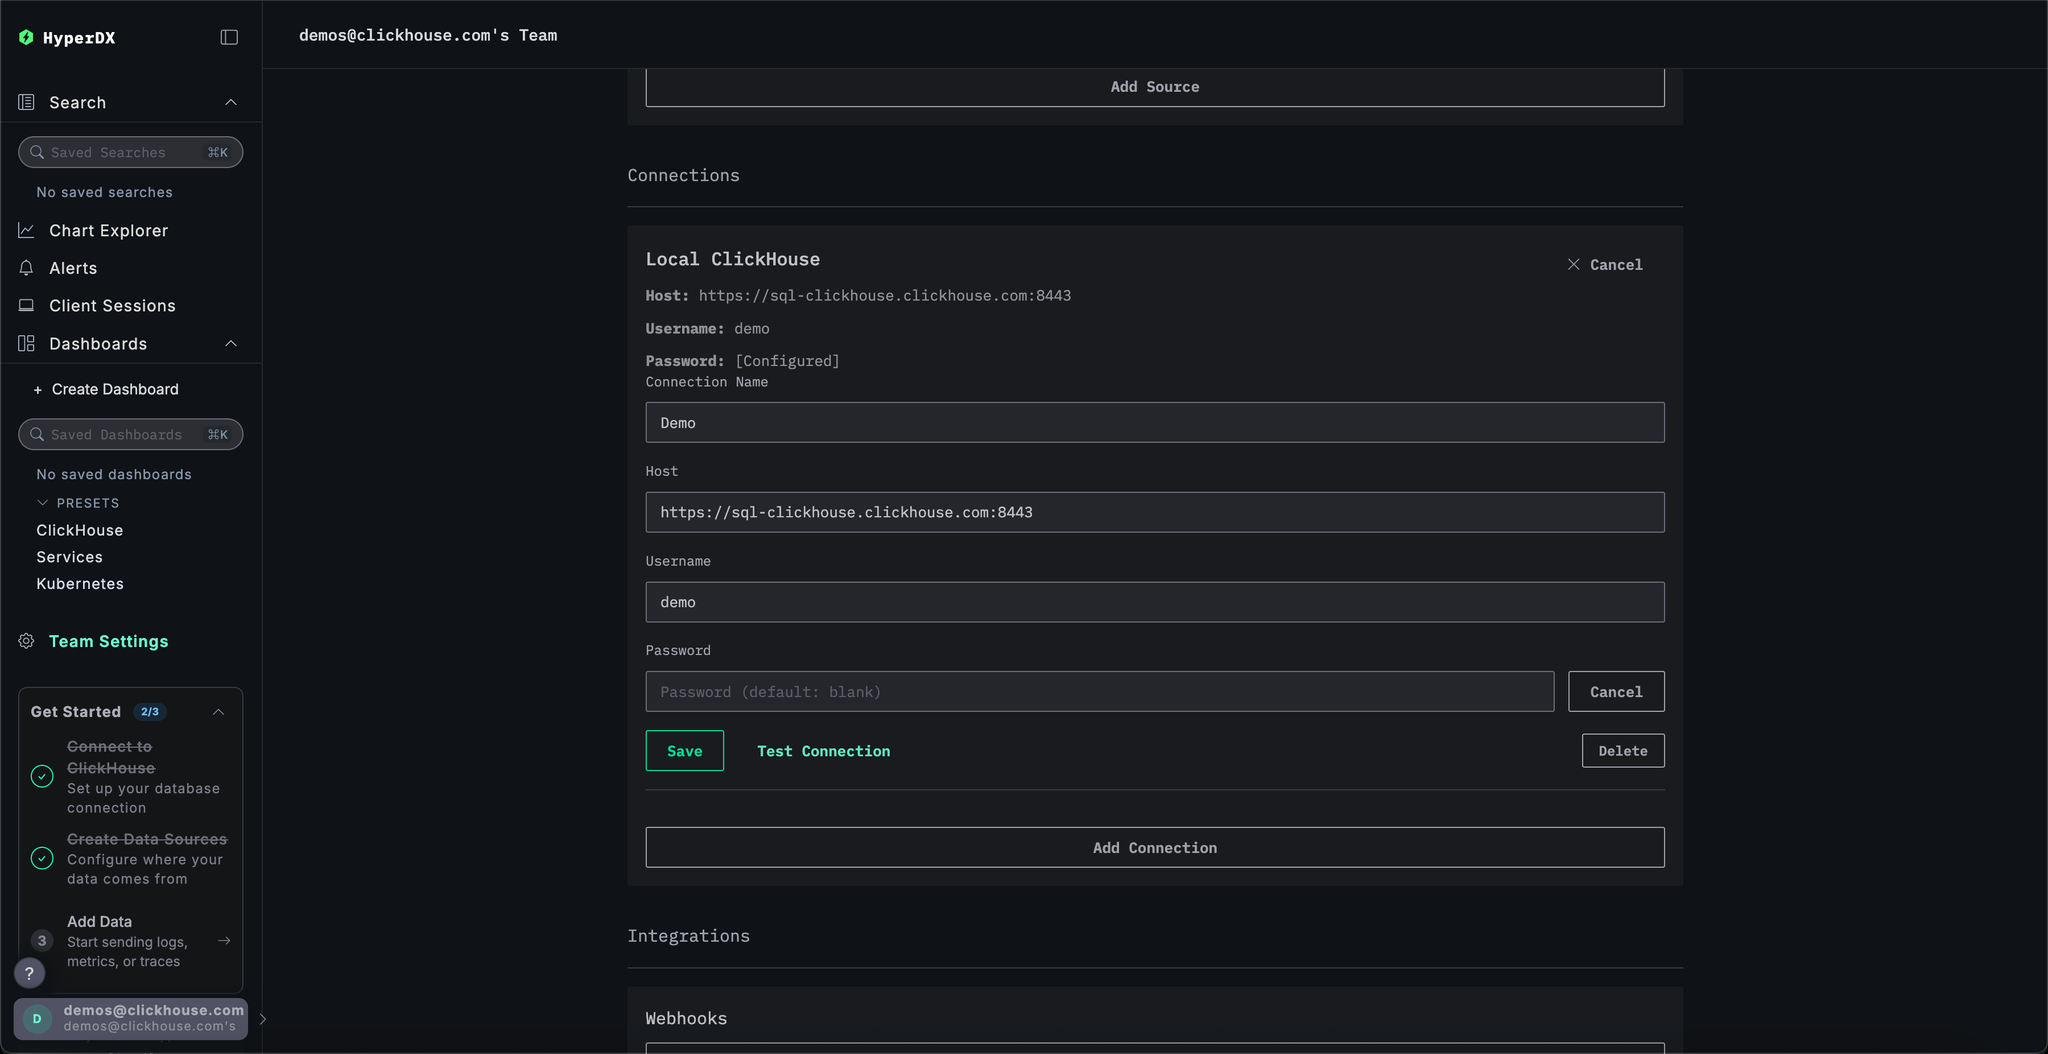
Rename the connection to Demo and complete the subsequent form with the following connection details for the demo server:
Connection Name:DemoHost:https://sql-clickhouse.clickhouse.comUsername:otel_demoPassword: Leave empty
This step can be skipped if you clicked Connect to Demo Server when deploying in Local Mode. If using this mode, sources will be prefixed with Demo_ e.g. Demo_Logs
Scroll up to Sources and modify each of the sources - Logs, Traces, Metrics, and Sessions - to use the otel_v2 database.
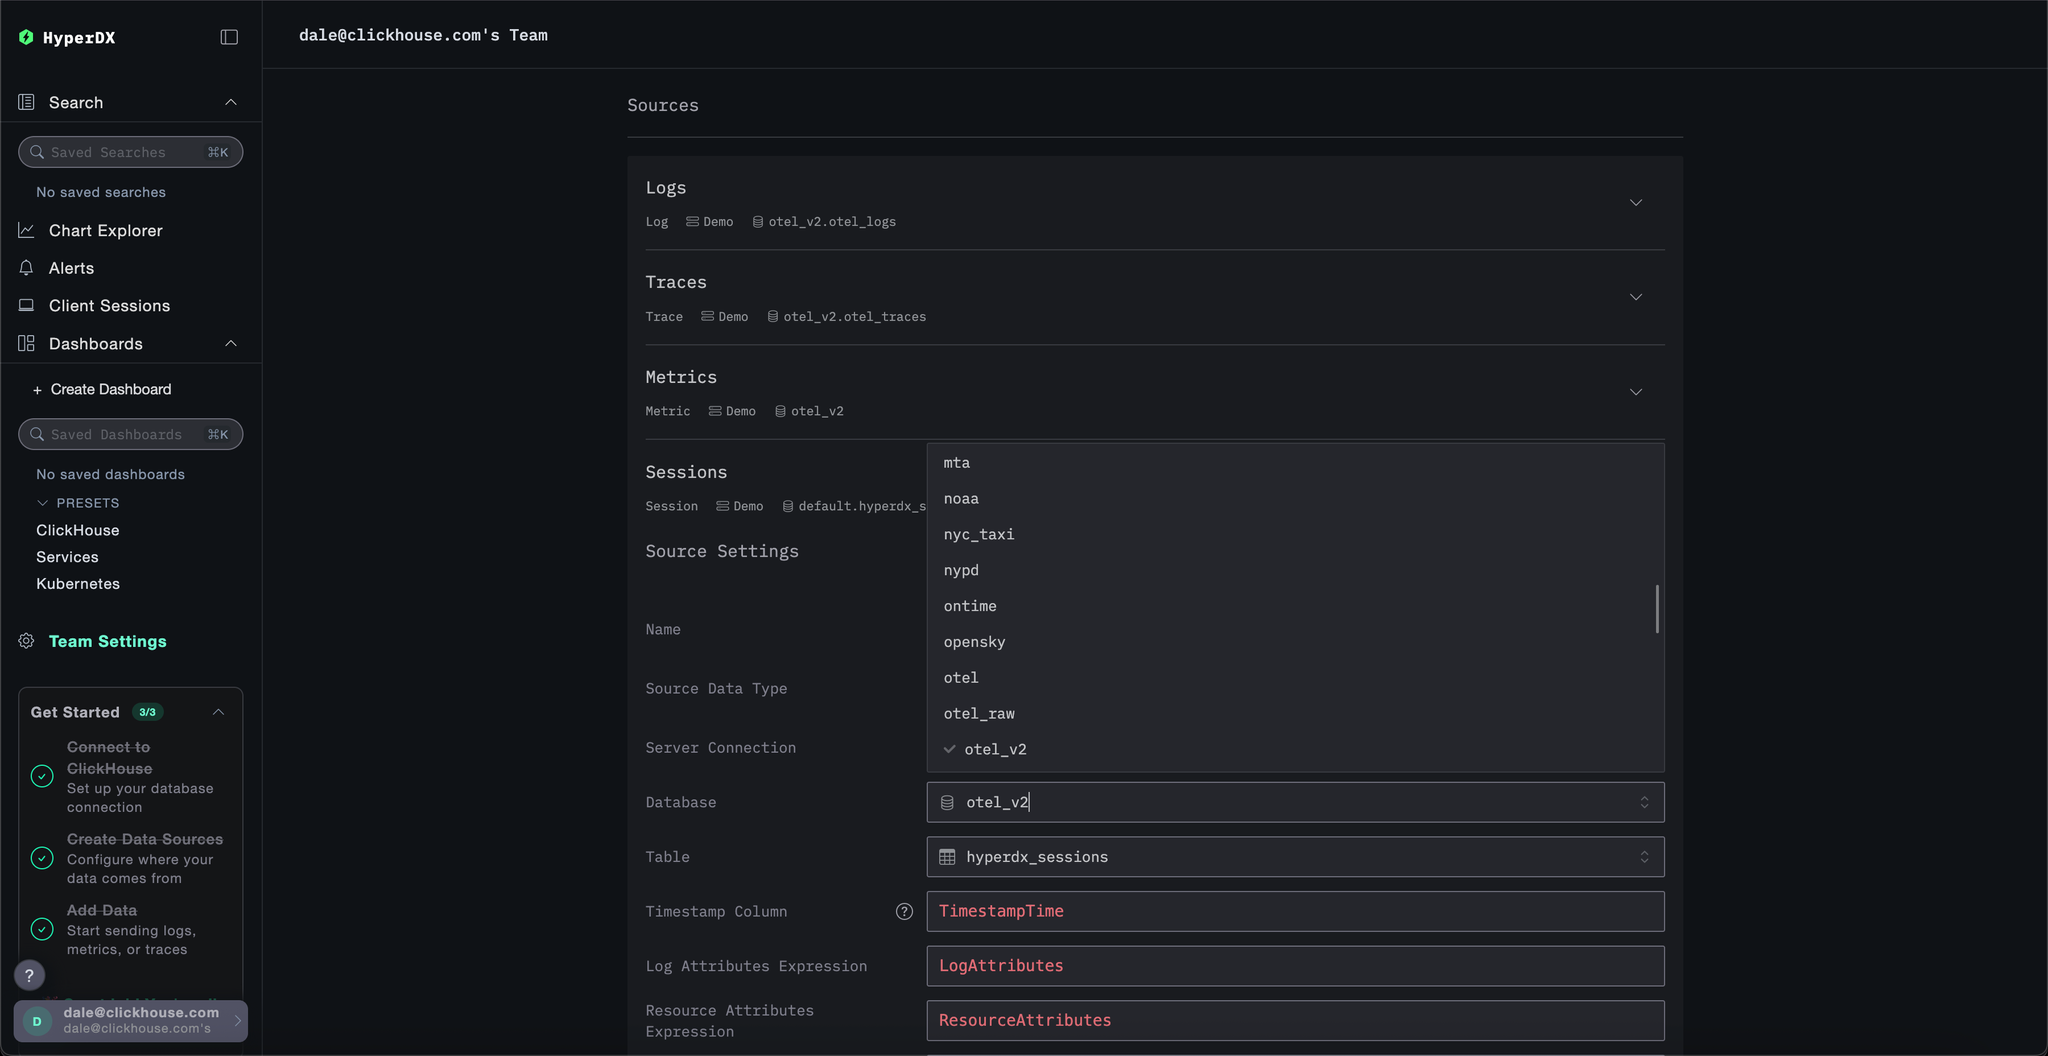
You may need to reload the page to ensure the full list of databases is listed in each source.
Adjust the time to show all data from the previous 1 day using the time picker in the top right.
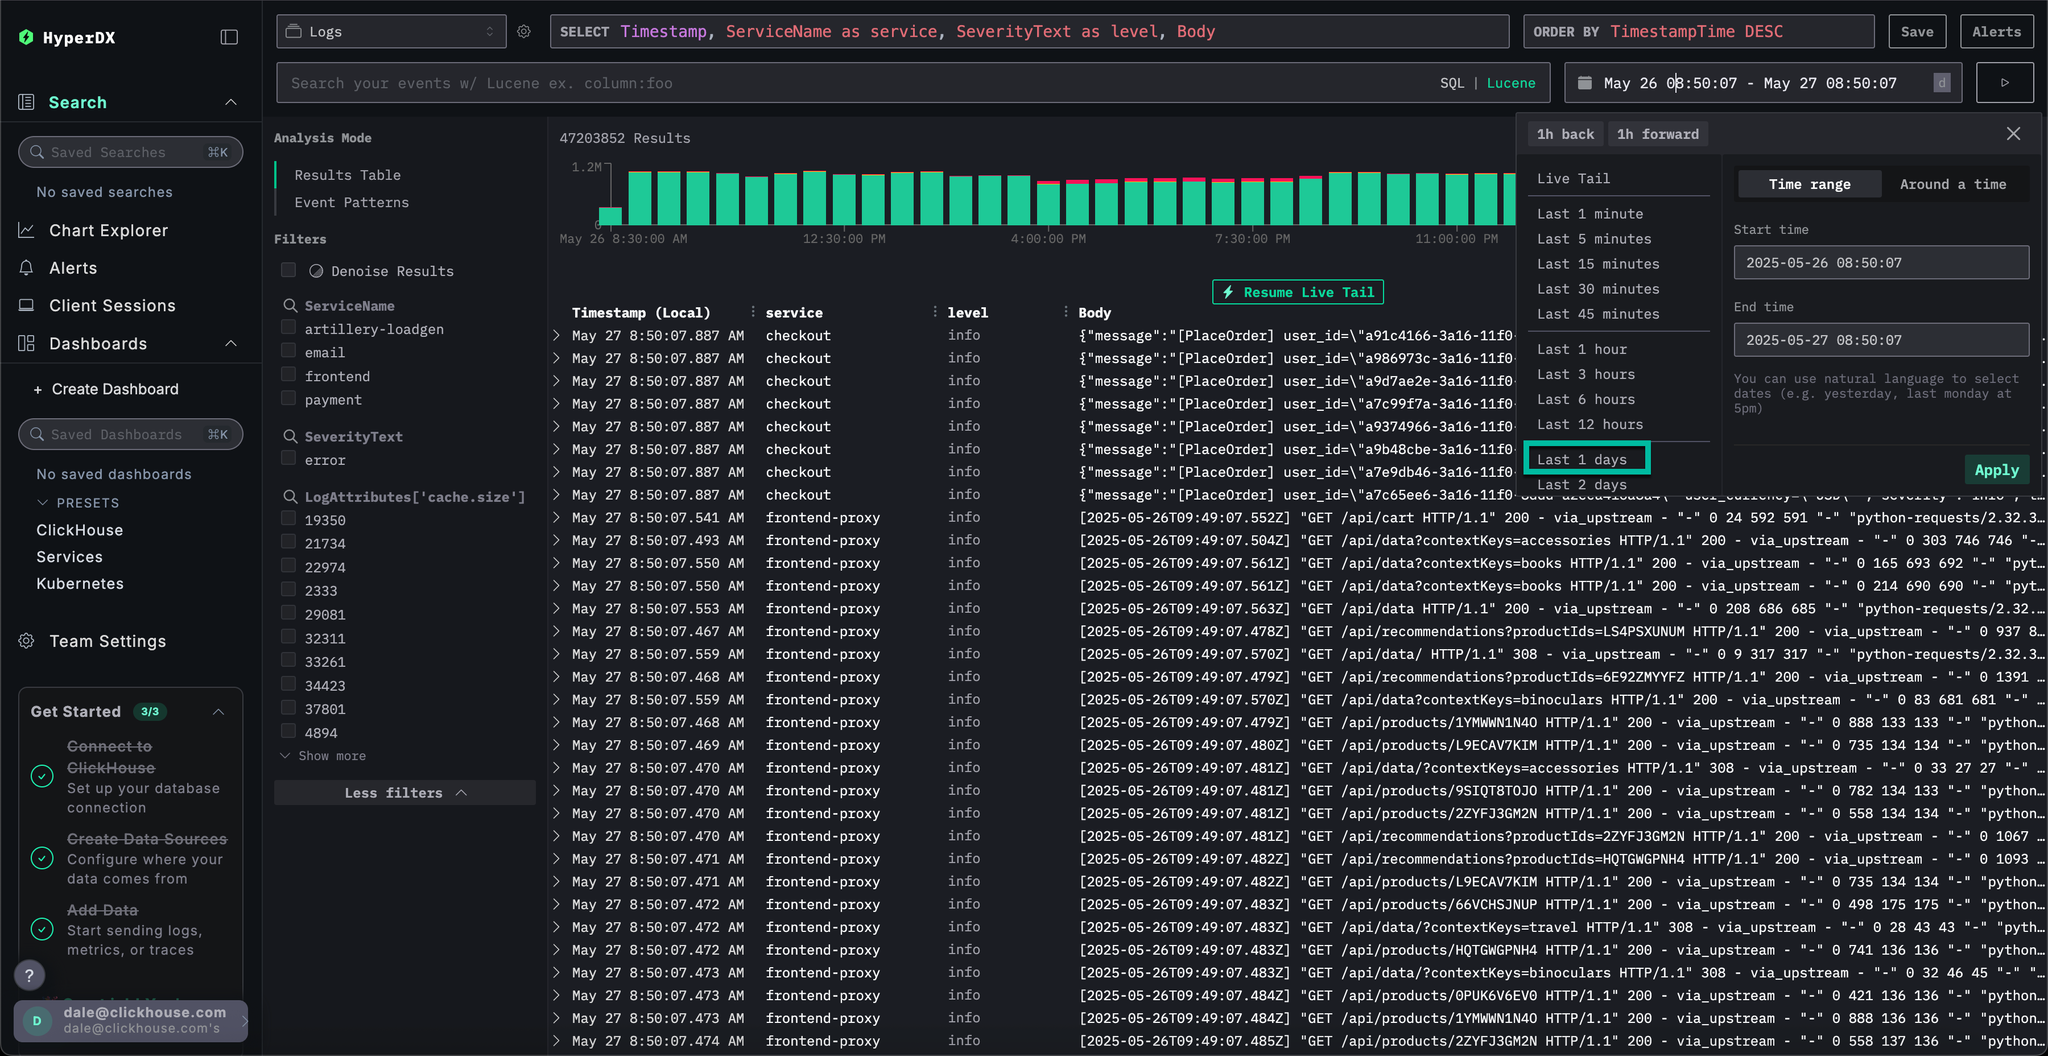
You may a small difference in the number of errors in the overview bar chart, with a small increase in red in several consecutive bars.
The location of the bars will differ depending on when you query the dataset.
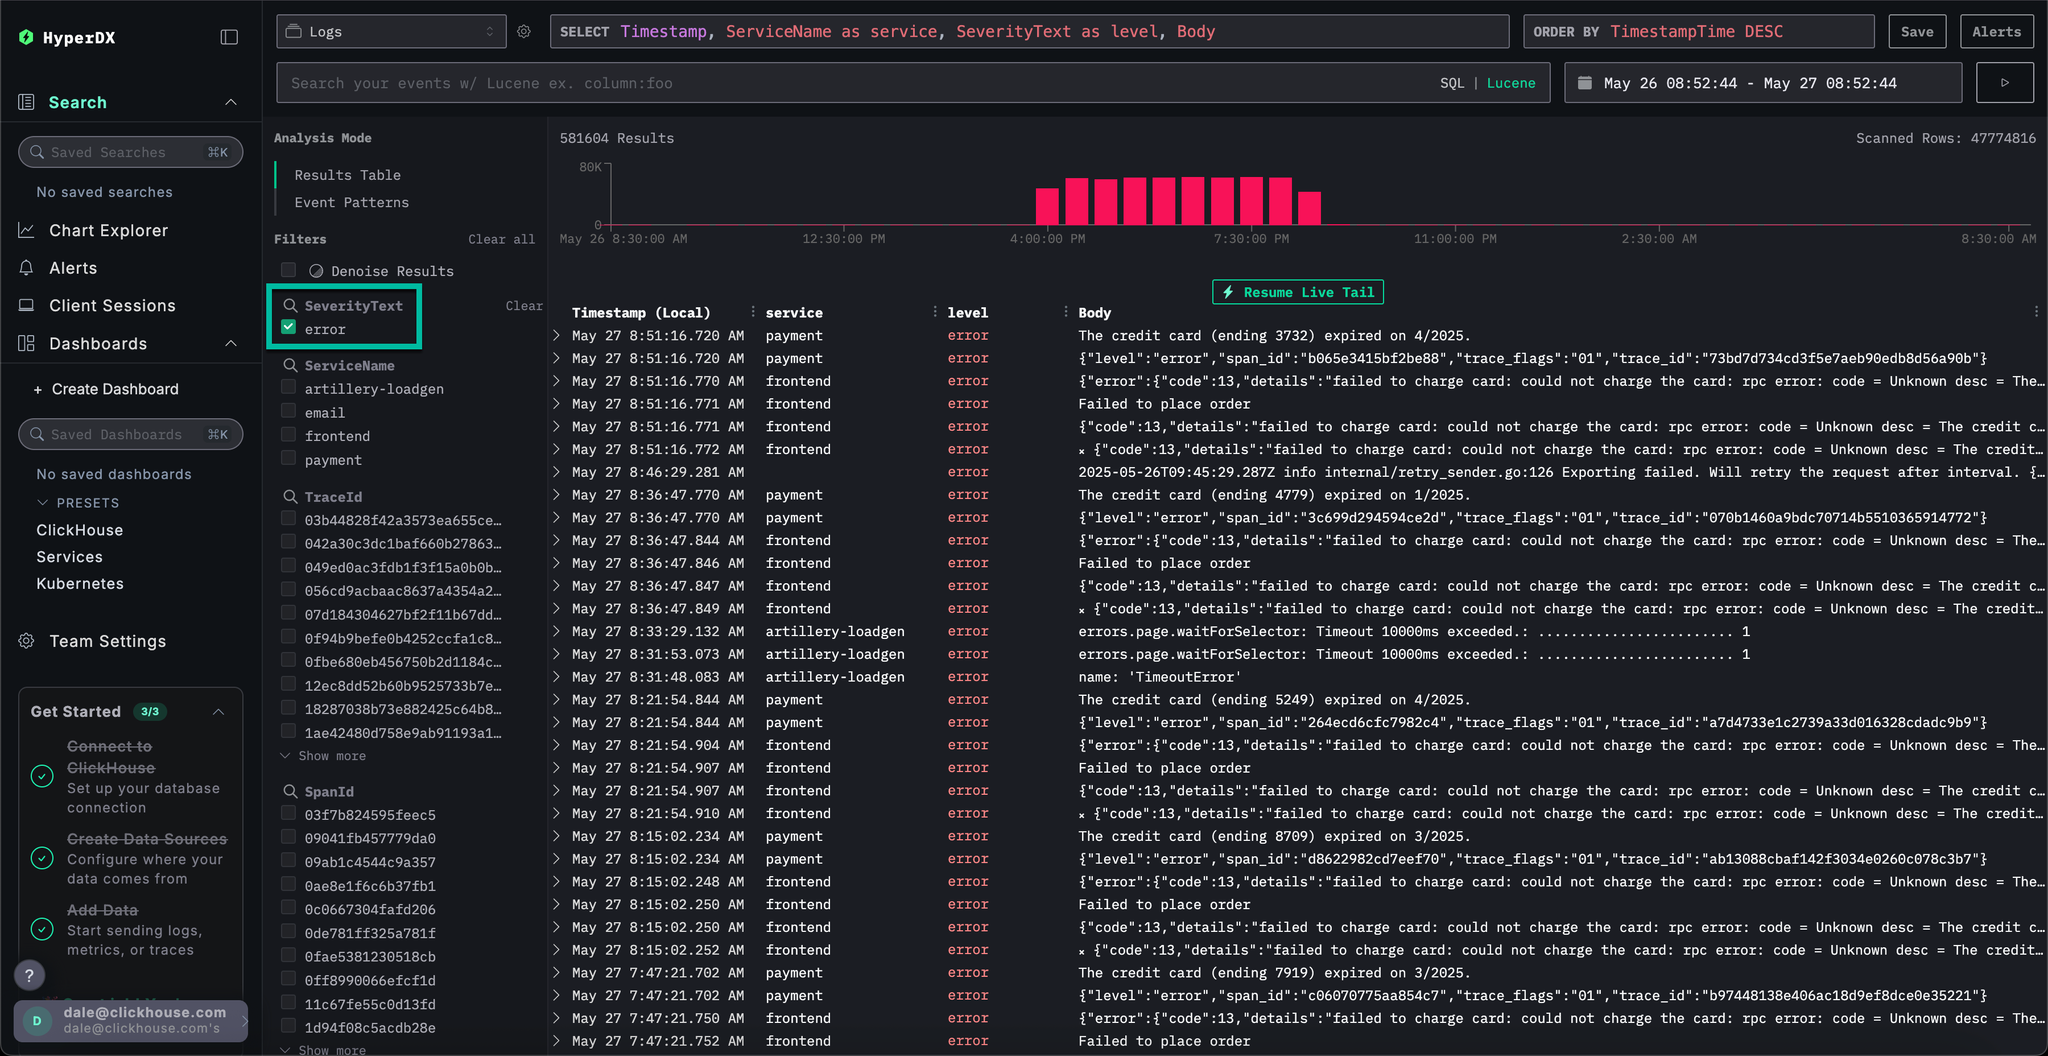
To highlight occurrences of errors, use the SeverityText filter and select error to display only error-level entries.
The error should be more apparent:
With HyperDX's Clustering feature, you can automatically identify errors and group them into meaningful patterns. This accelerates user analysis when dealing with large volumes of log and traces. To use it, select Event Patterns from the Analysis Mode menu on the left panel.
The error clusters reveal issues related to failed payments, including a named pattern Failed to place order. Additional clusters also indicate problems charging cards and caches being full.
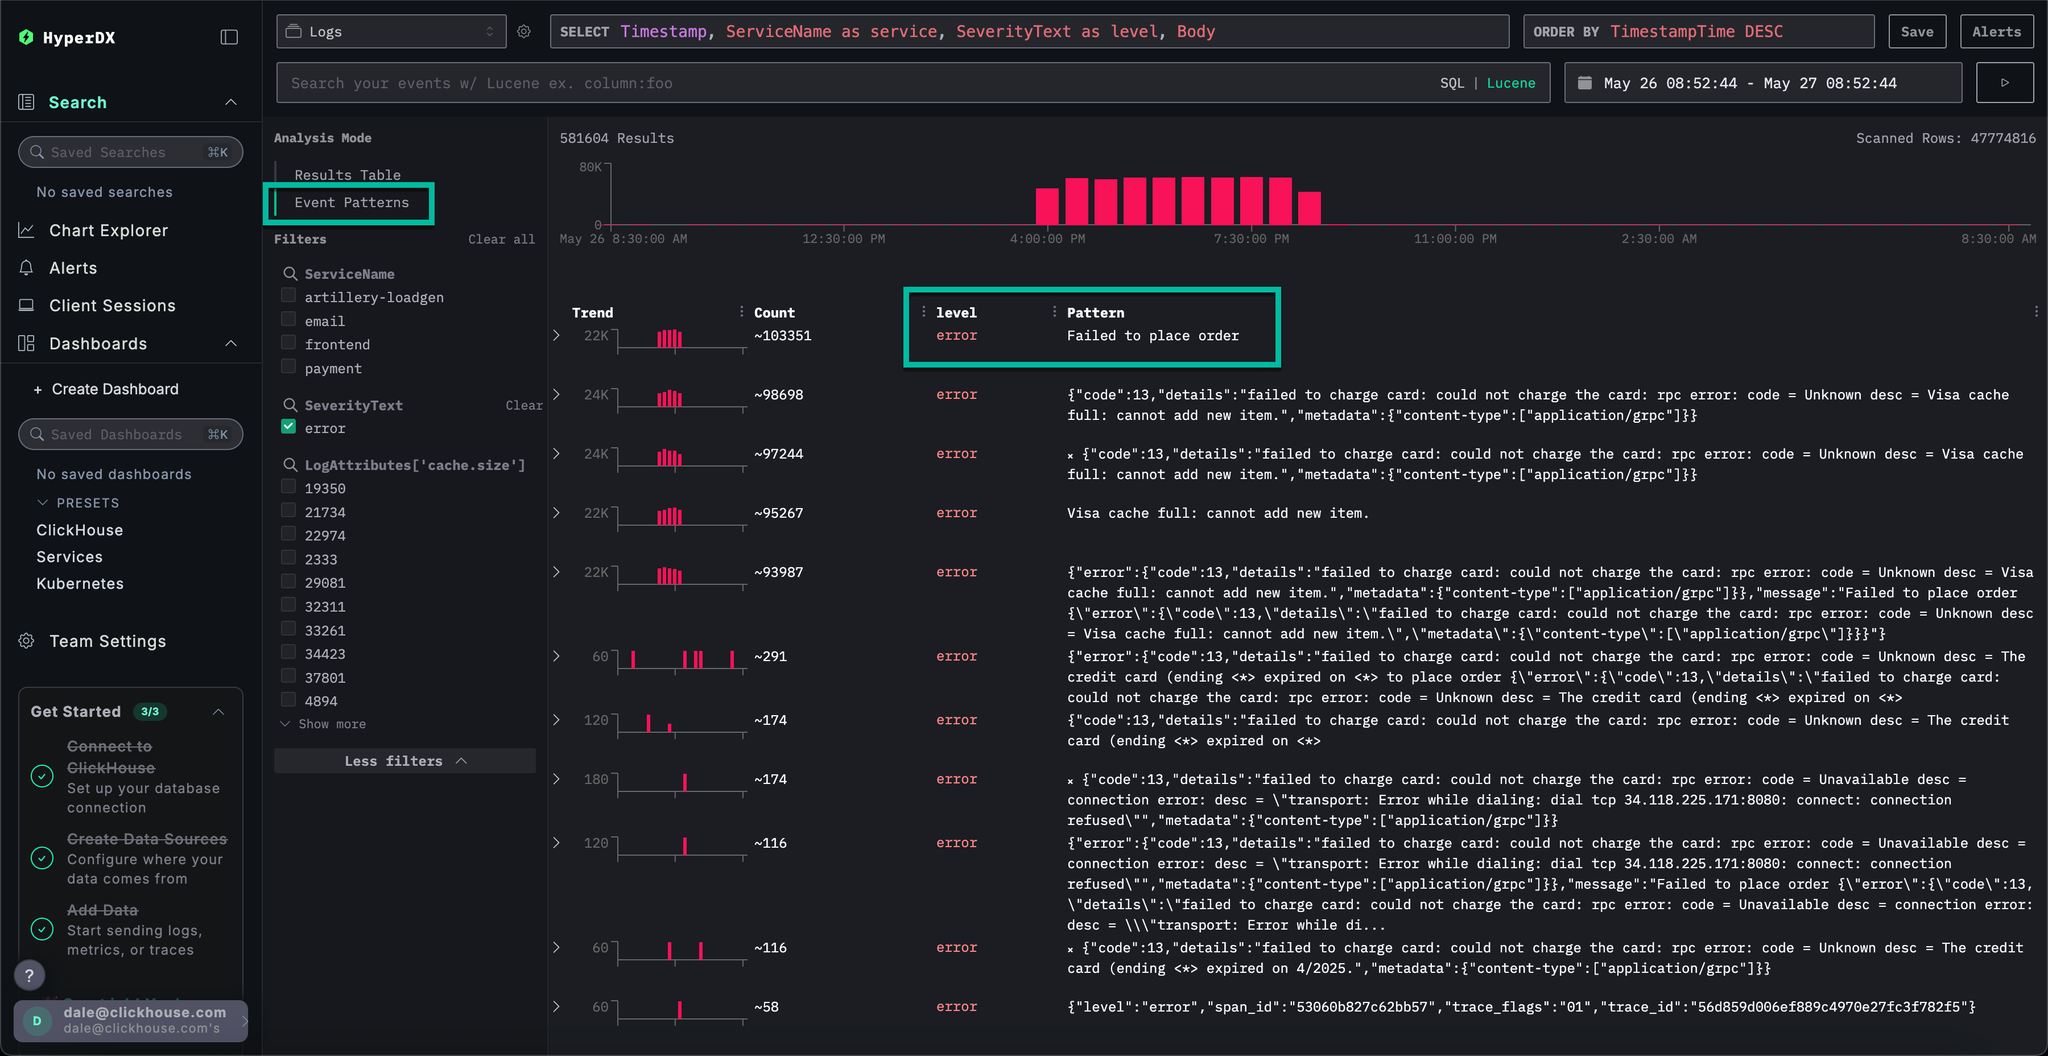
Note that these error clusters likely originate from different services.
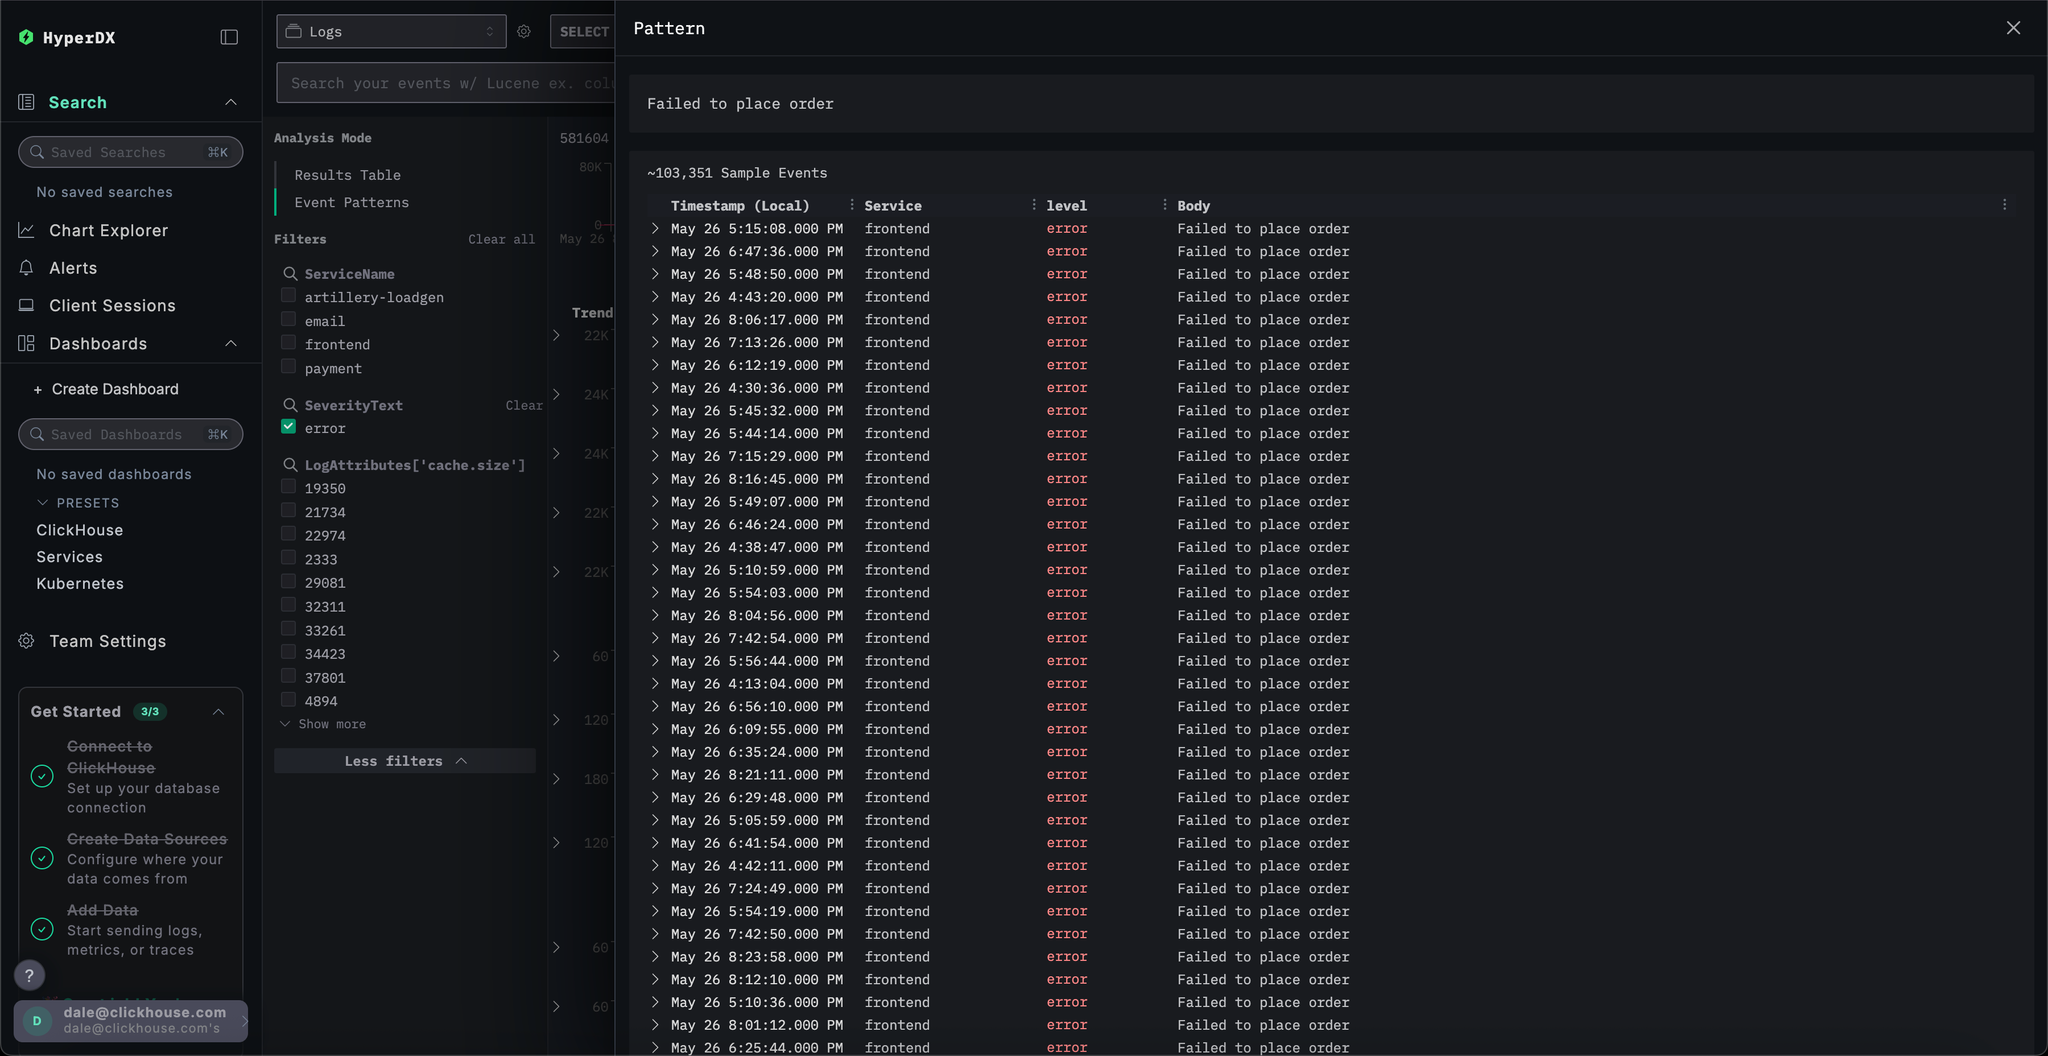
Click the most obvious error clusters which correlates with our reported issue of users being able to complete payments: Failed to place order.
This will display a list of all occurrences of this error which are associated with the frontend service:
Select any of the resulting errors. The logs metadata will be shown in detail. Scrolling through both the Overview and Column Values suggests an issue with the charging cards due to a cache:
failed to charge card: could not charge the card: rpc error: code = Unknown desc = Visa cache full: cannot add new item.
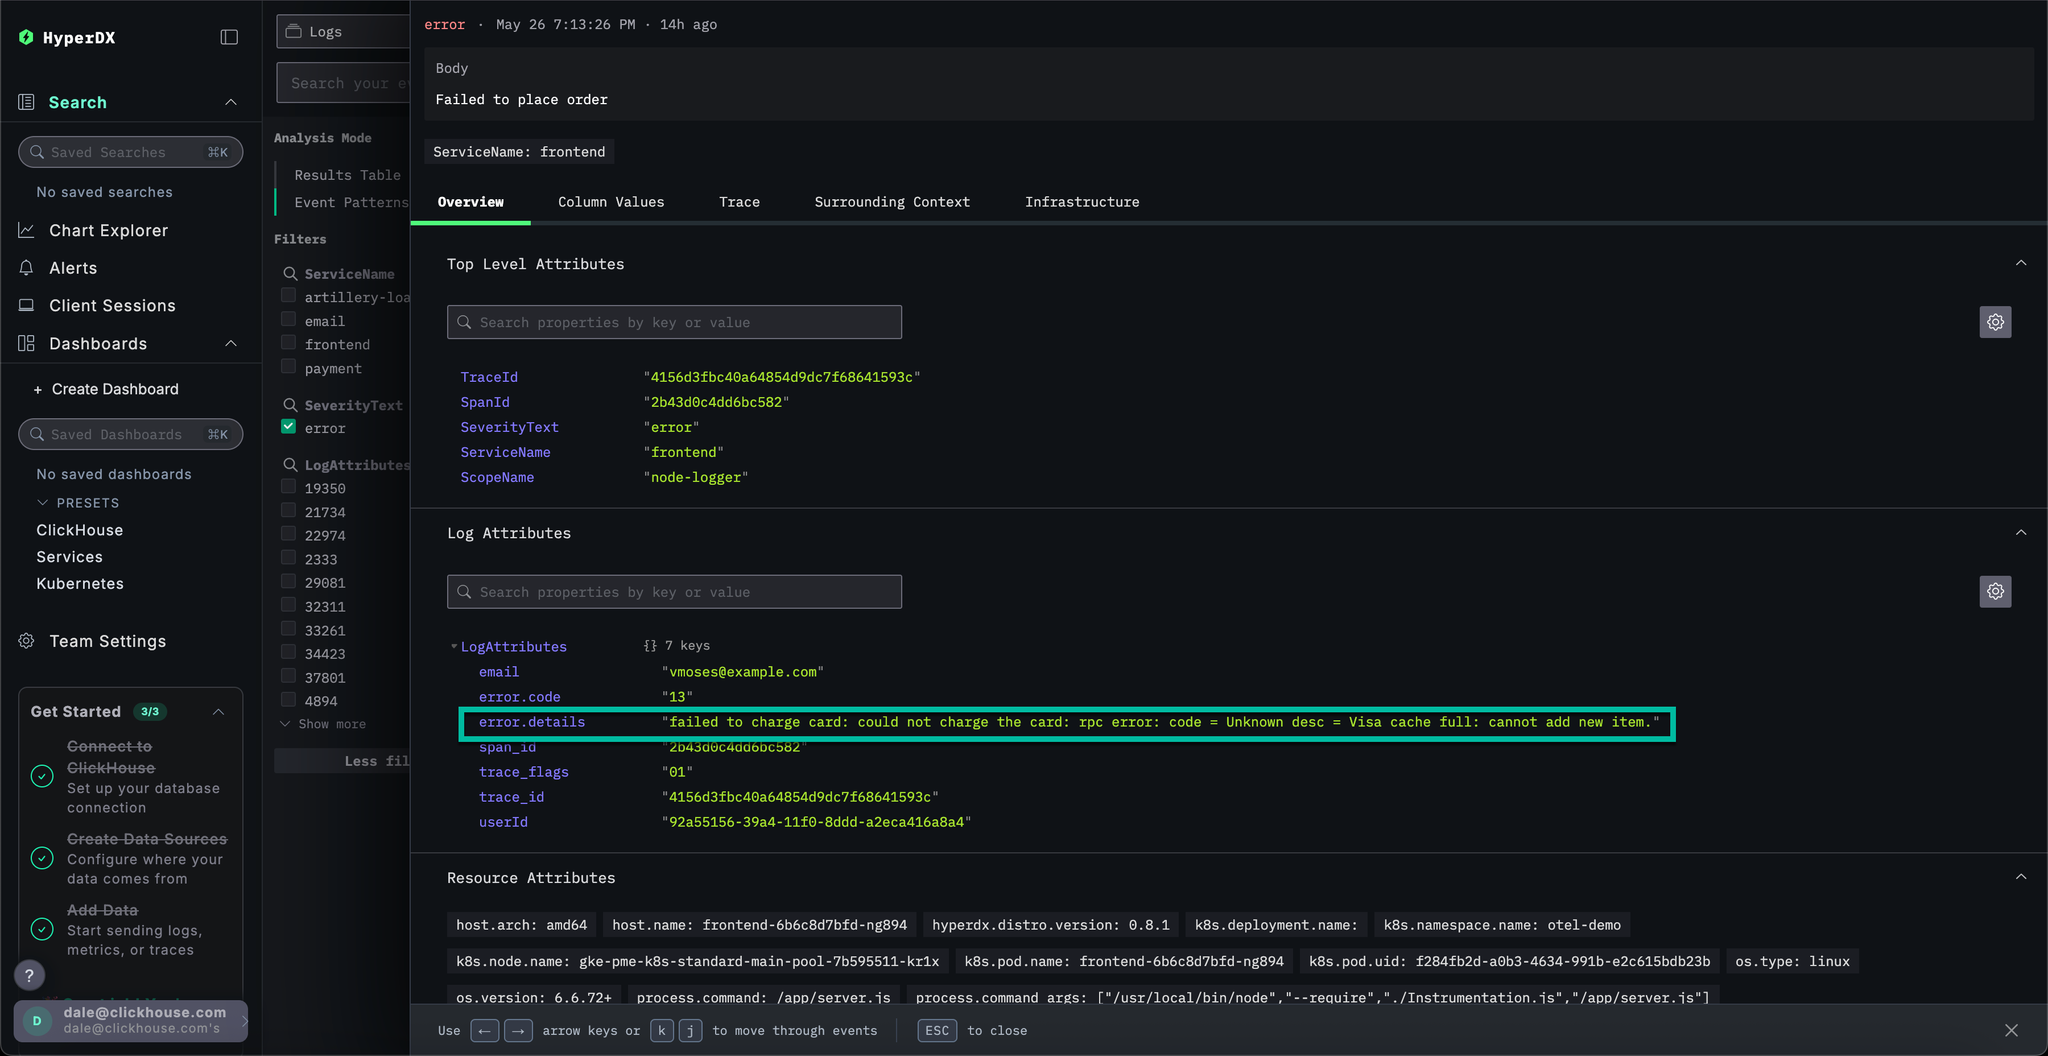
We've identified a cache-related error that's likely causing payment failures. We still need to identify where this issue is originating from in our microservice architecture.
Given the cache issue, it makes sense to investigate the underlying infrastructure - potentially we have memory problem in the associated pods? In ClickStack, logs and metrics are unified and displayed in context, making it easier to uncover the root cause quickly.
Select the Infrastructure tab to view the metrics associated with the underlying pods for the frontend service and widen the timespan to 1d:
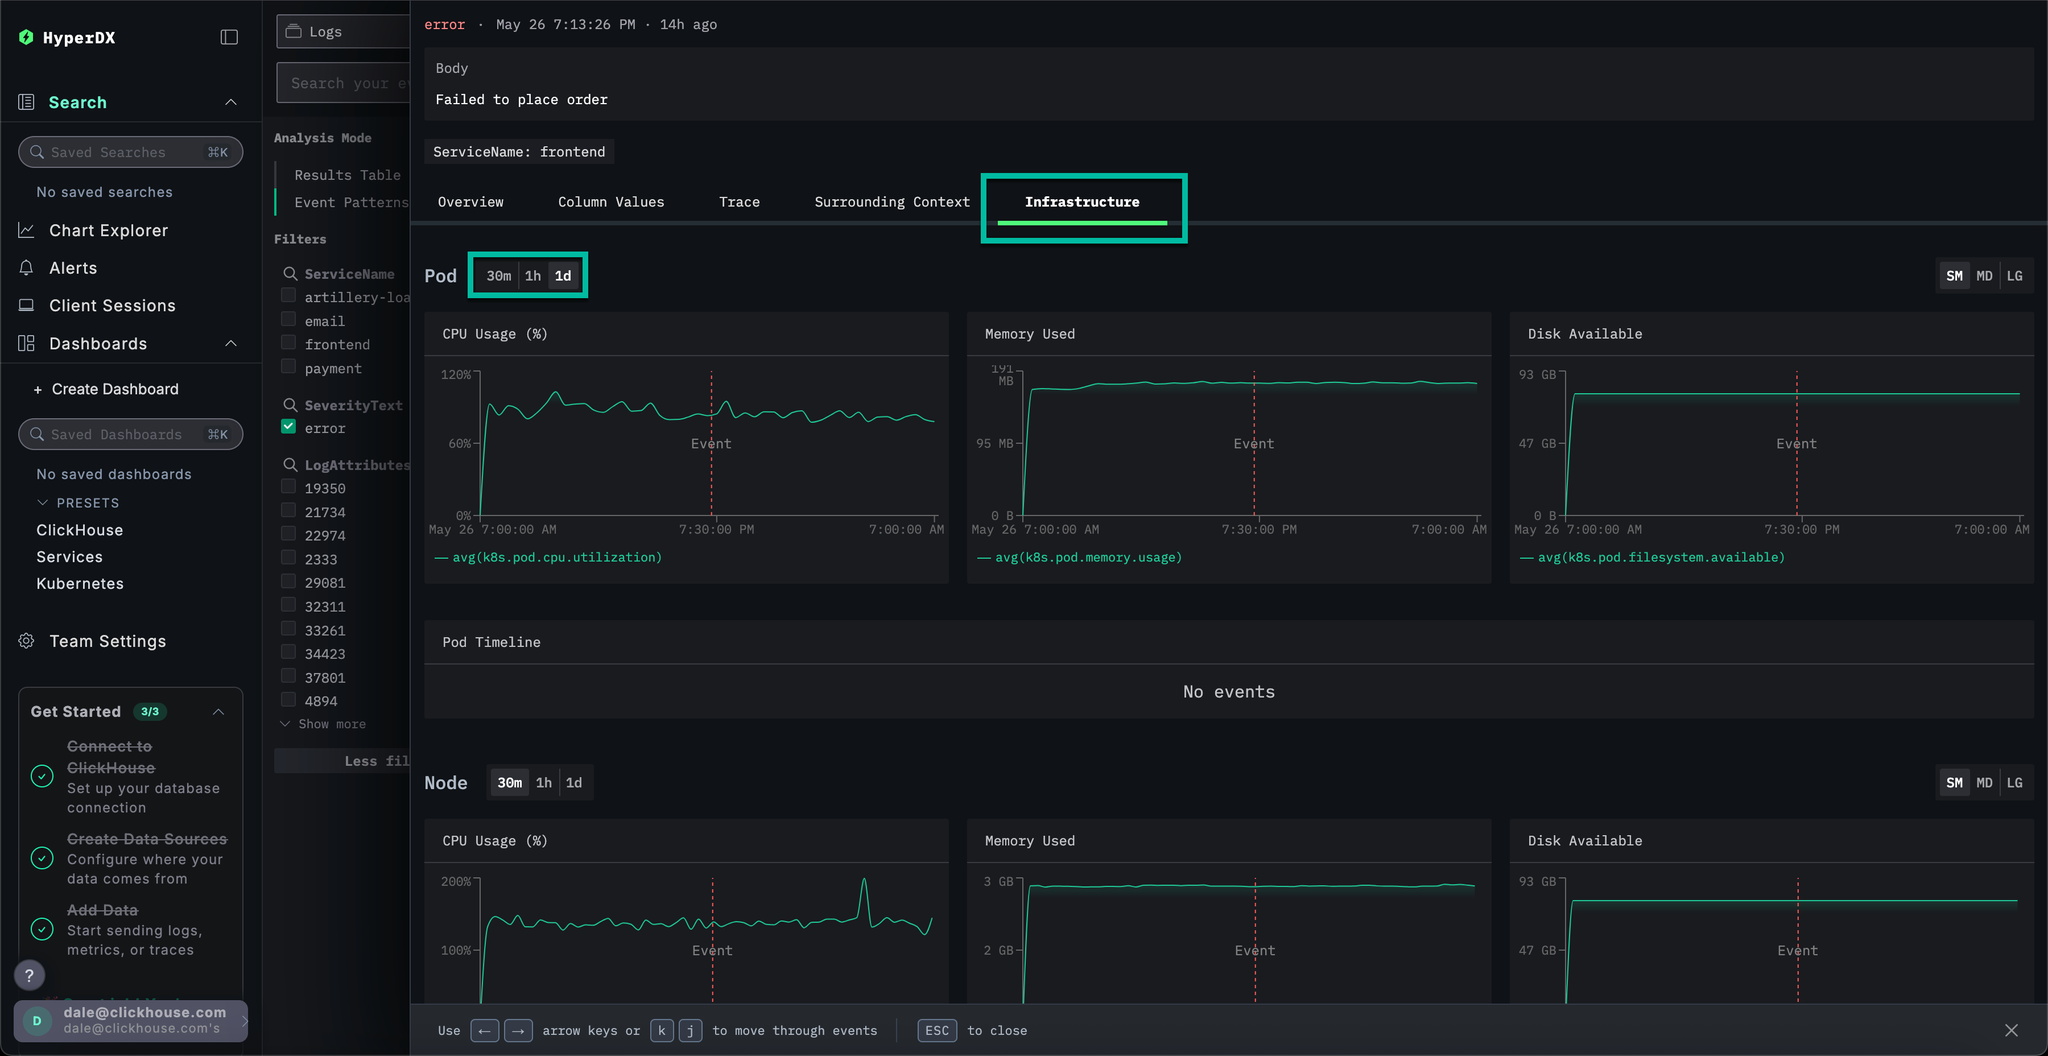
The issue does not seem to infrastructure related - no metrics have appreciably changed over the time period: either before or after the error. Close the infrastructure tab.
In ClickStack, traces are also automatically correlated with both logs and metrics. Let's explore the trace linked to our selected log to identify the service responsible.
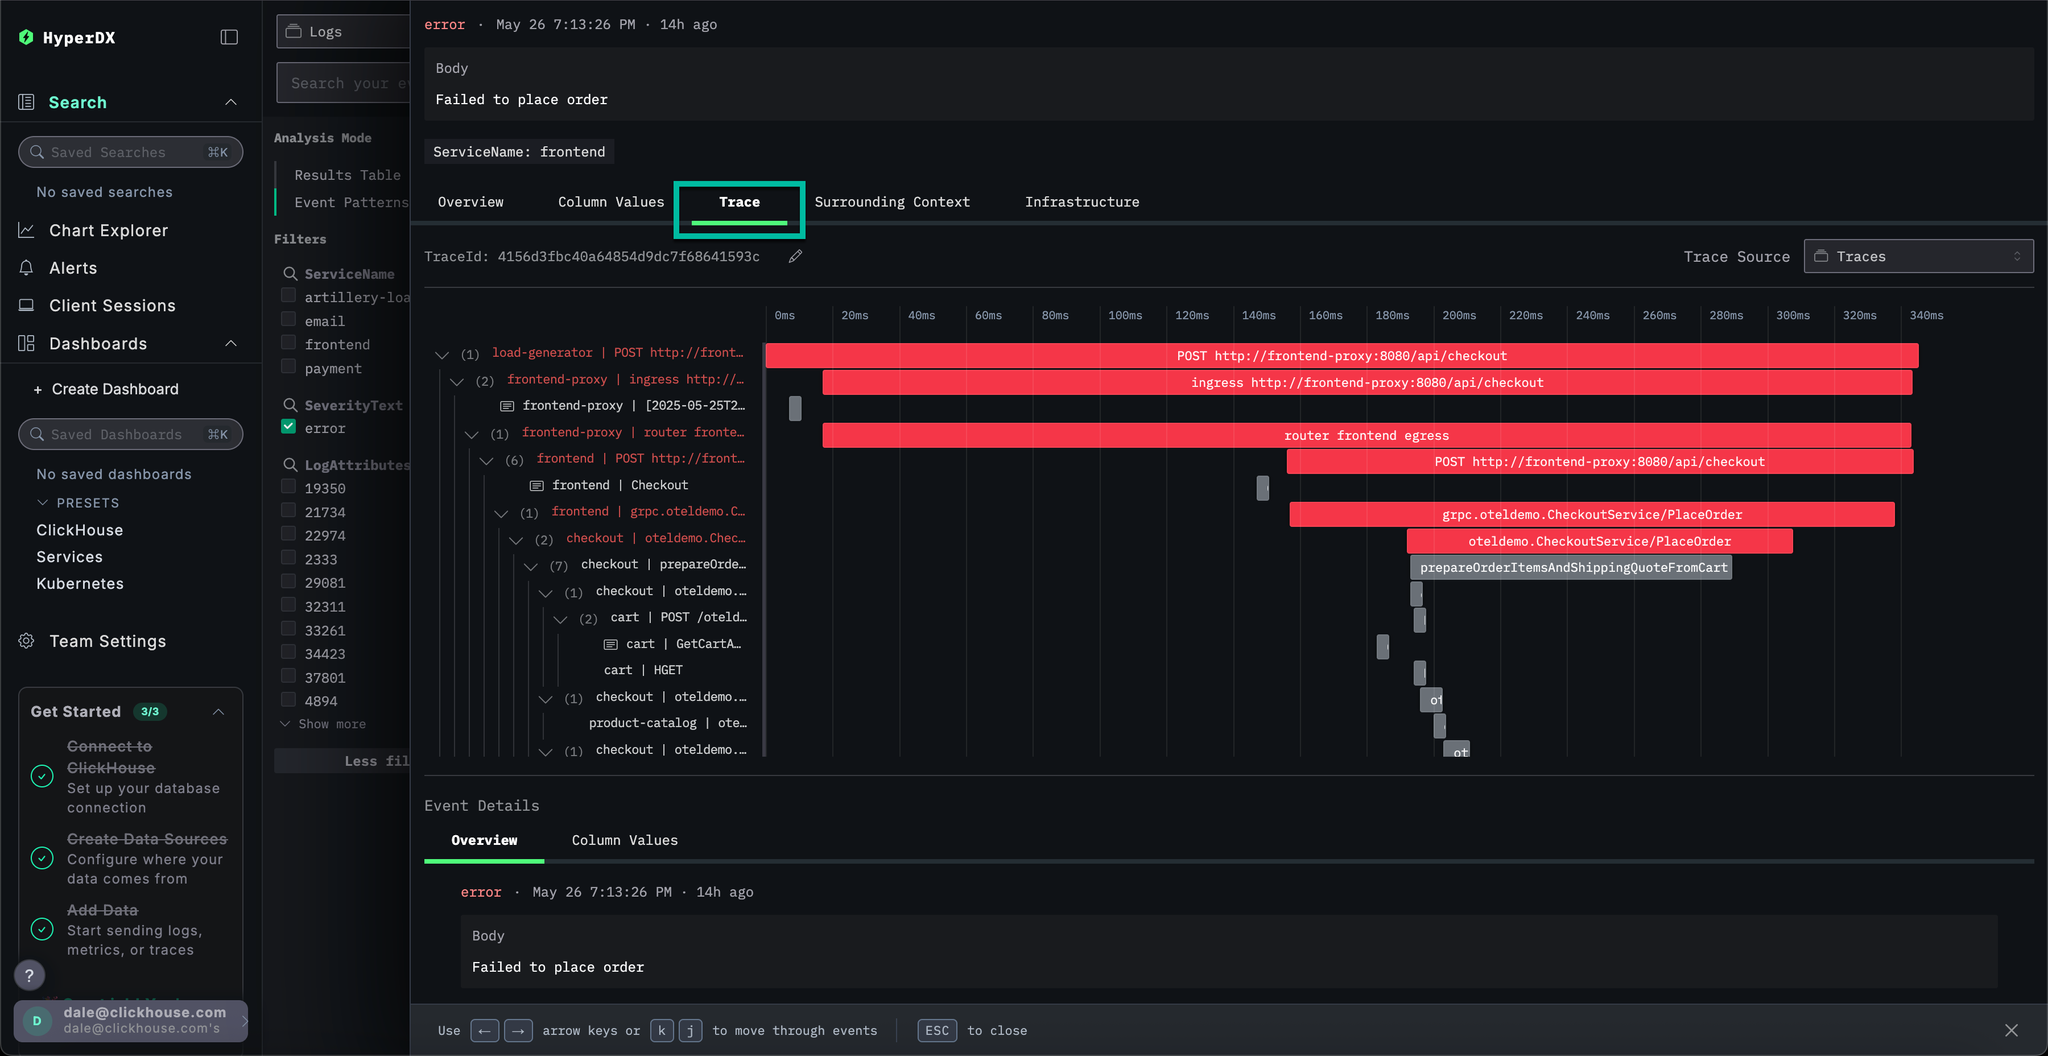
Select Trace to visualize the associated trace. Scrolling down through the subsequent view we can see how HyperDX is able to visualize the distributed trace across the microservices, connecting the spans in each service. A payment clearly involves multiple microservices, including those that performance checkout and currency conversions.
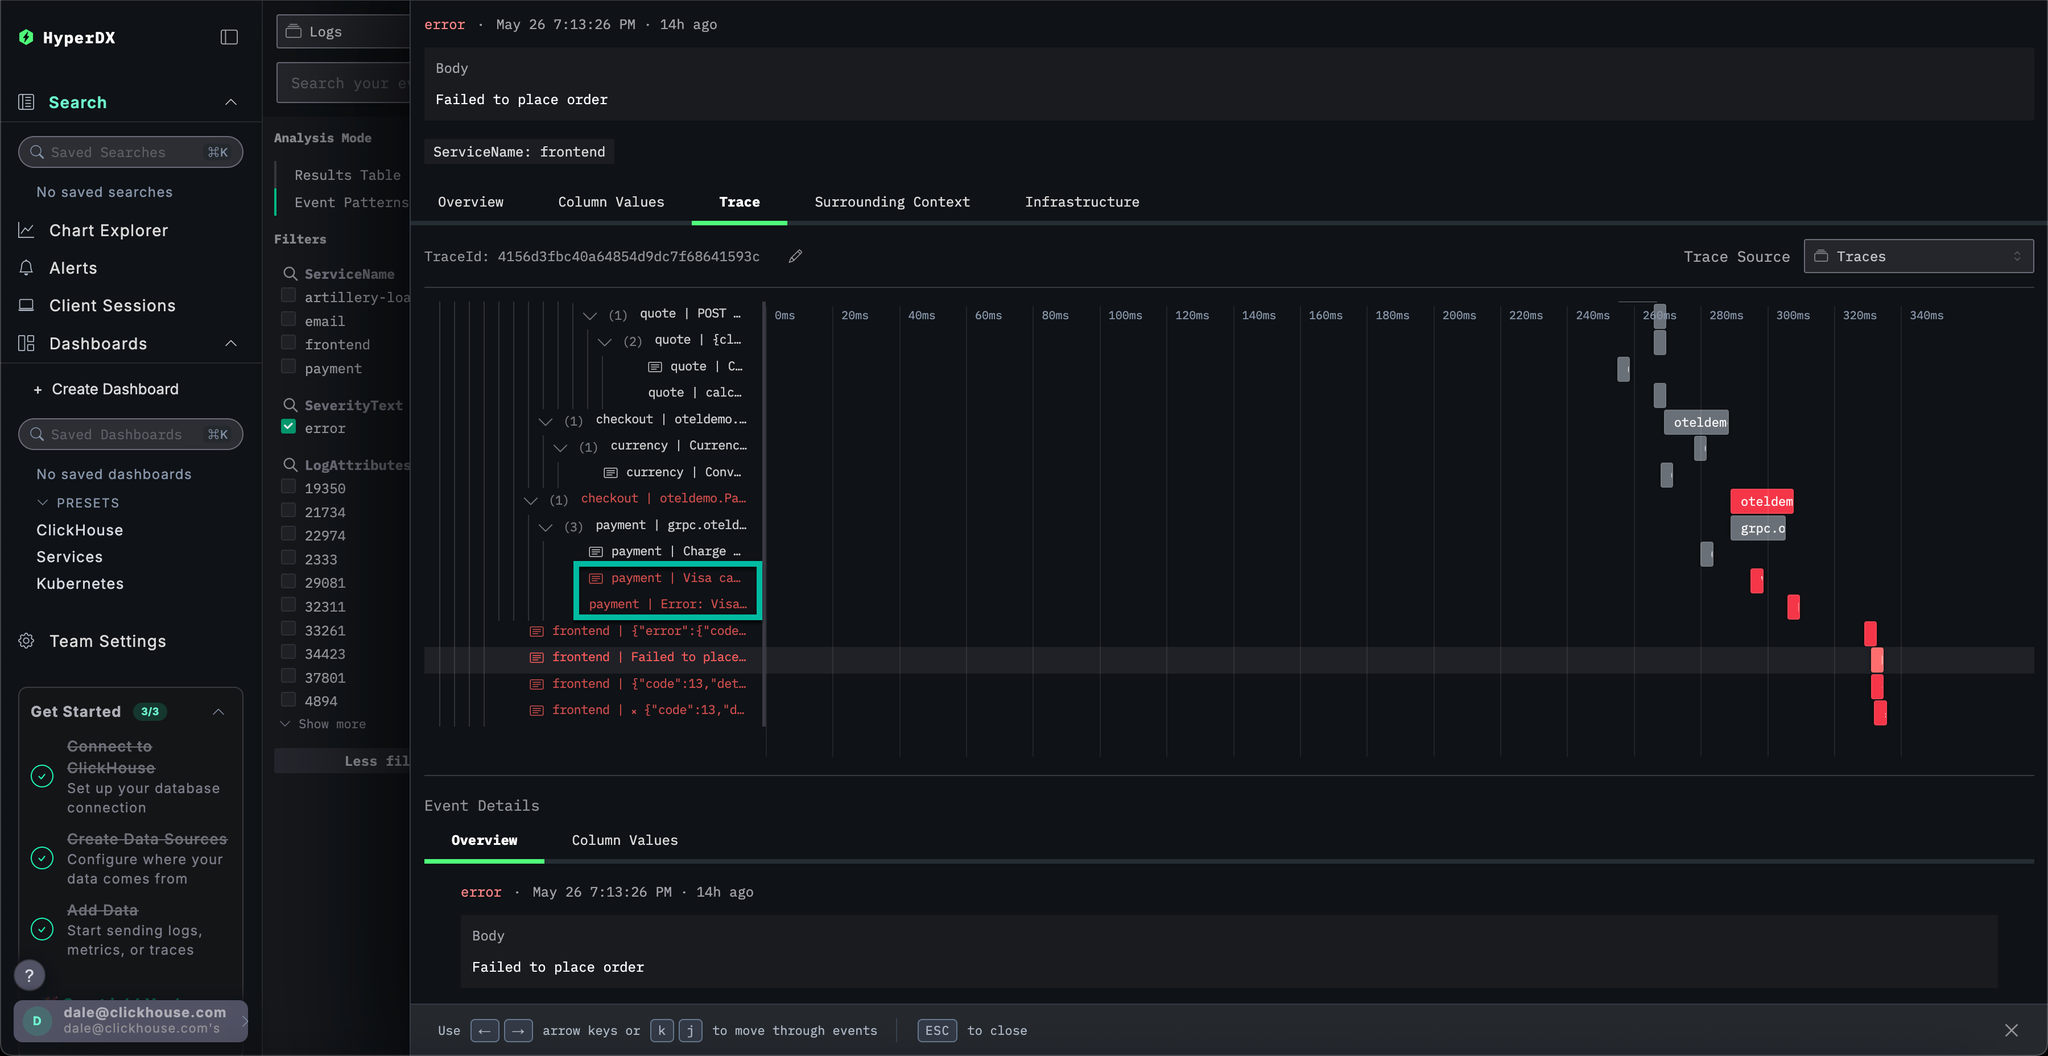
By scrolling to the bottom of the view we can see that the payment service is causing the error, which in turn propagates back up the call chain.
We have established users are failing to complete purchases due to a cache issue in the payment service. Let's explore the traces for this service in more detail to see if we can learn more about the root cause.
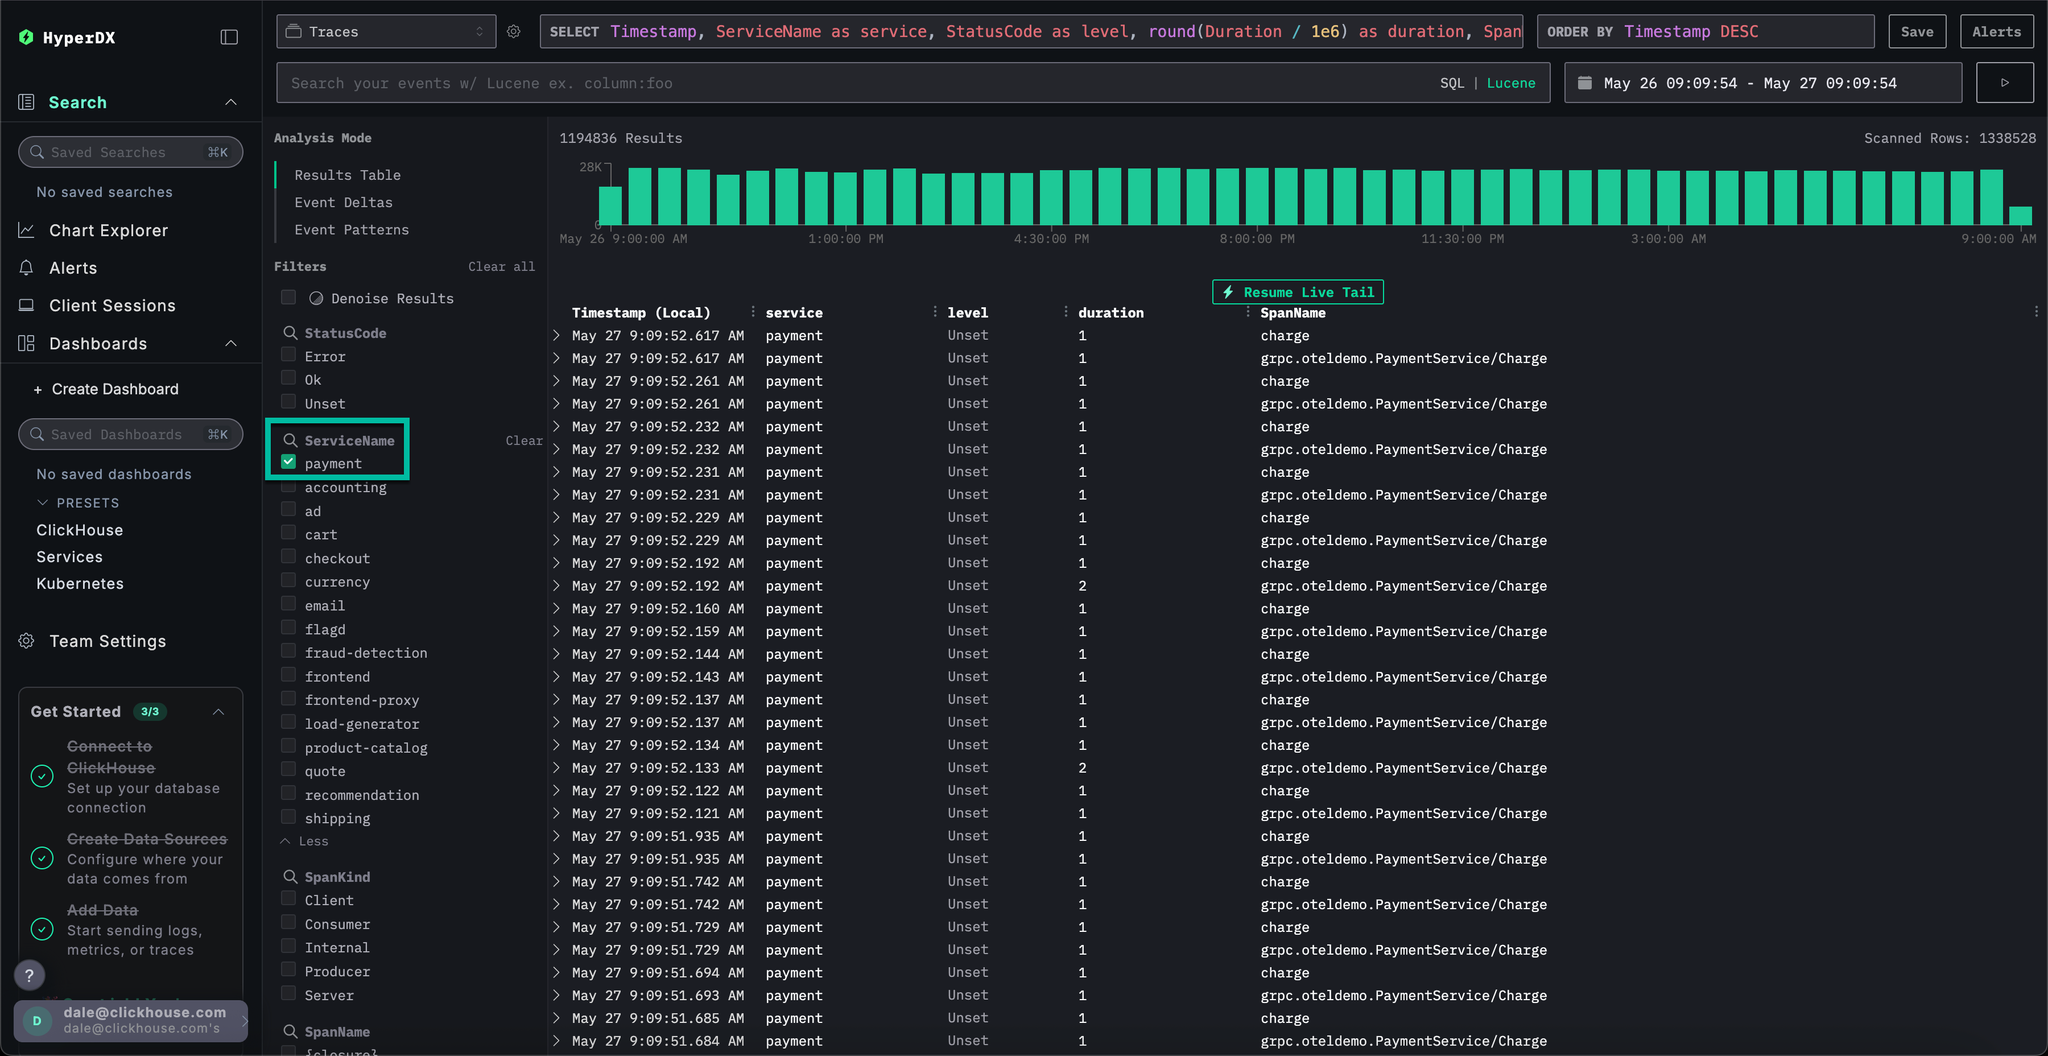
Switch to the main Search view by selecting Search. Switch the data source for Traces and select the Results table view. Ensure the timespan is still over the last day.
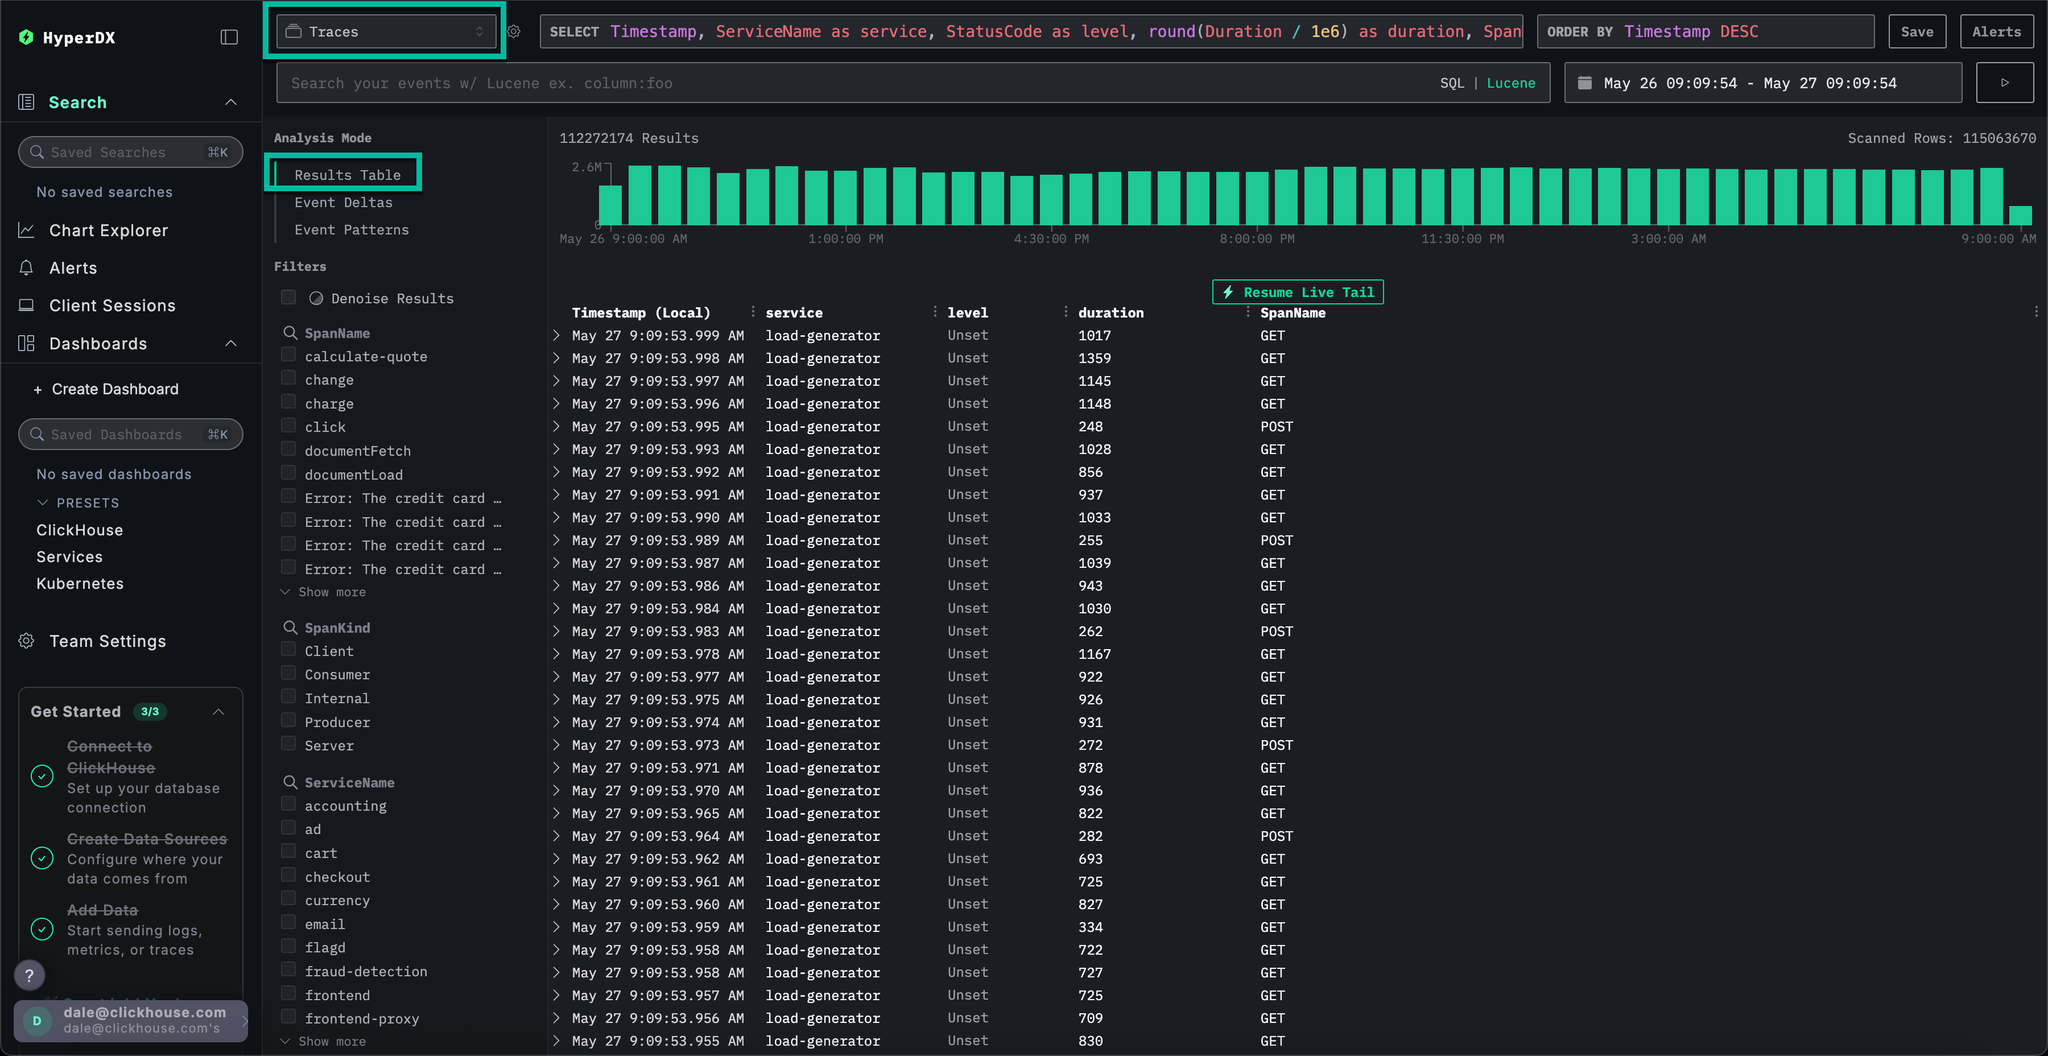
This view shows all traces in the last day. We know the issue originates in our payment service, so apply the payment filter to the ServiceName.
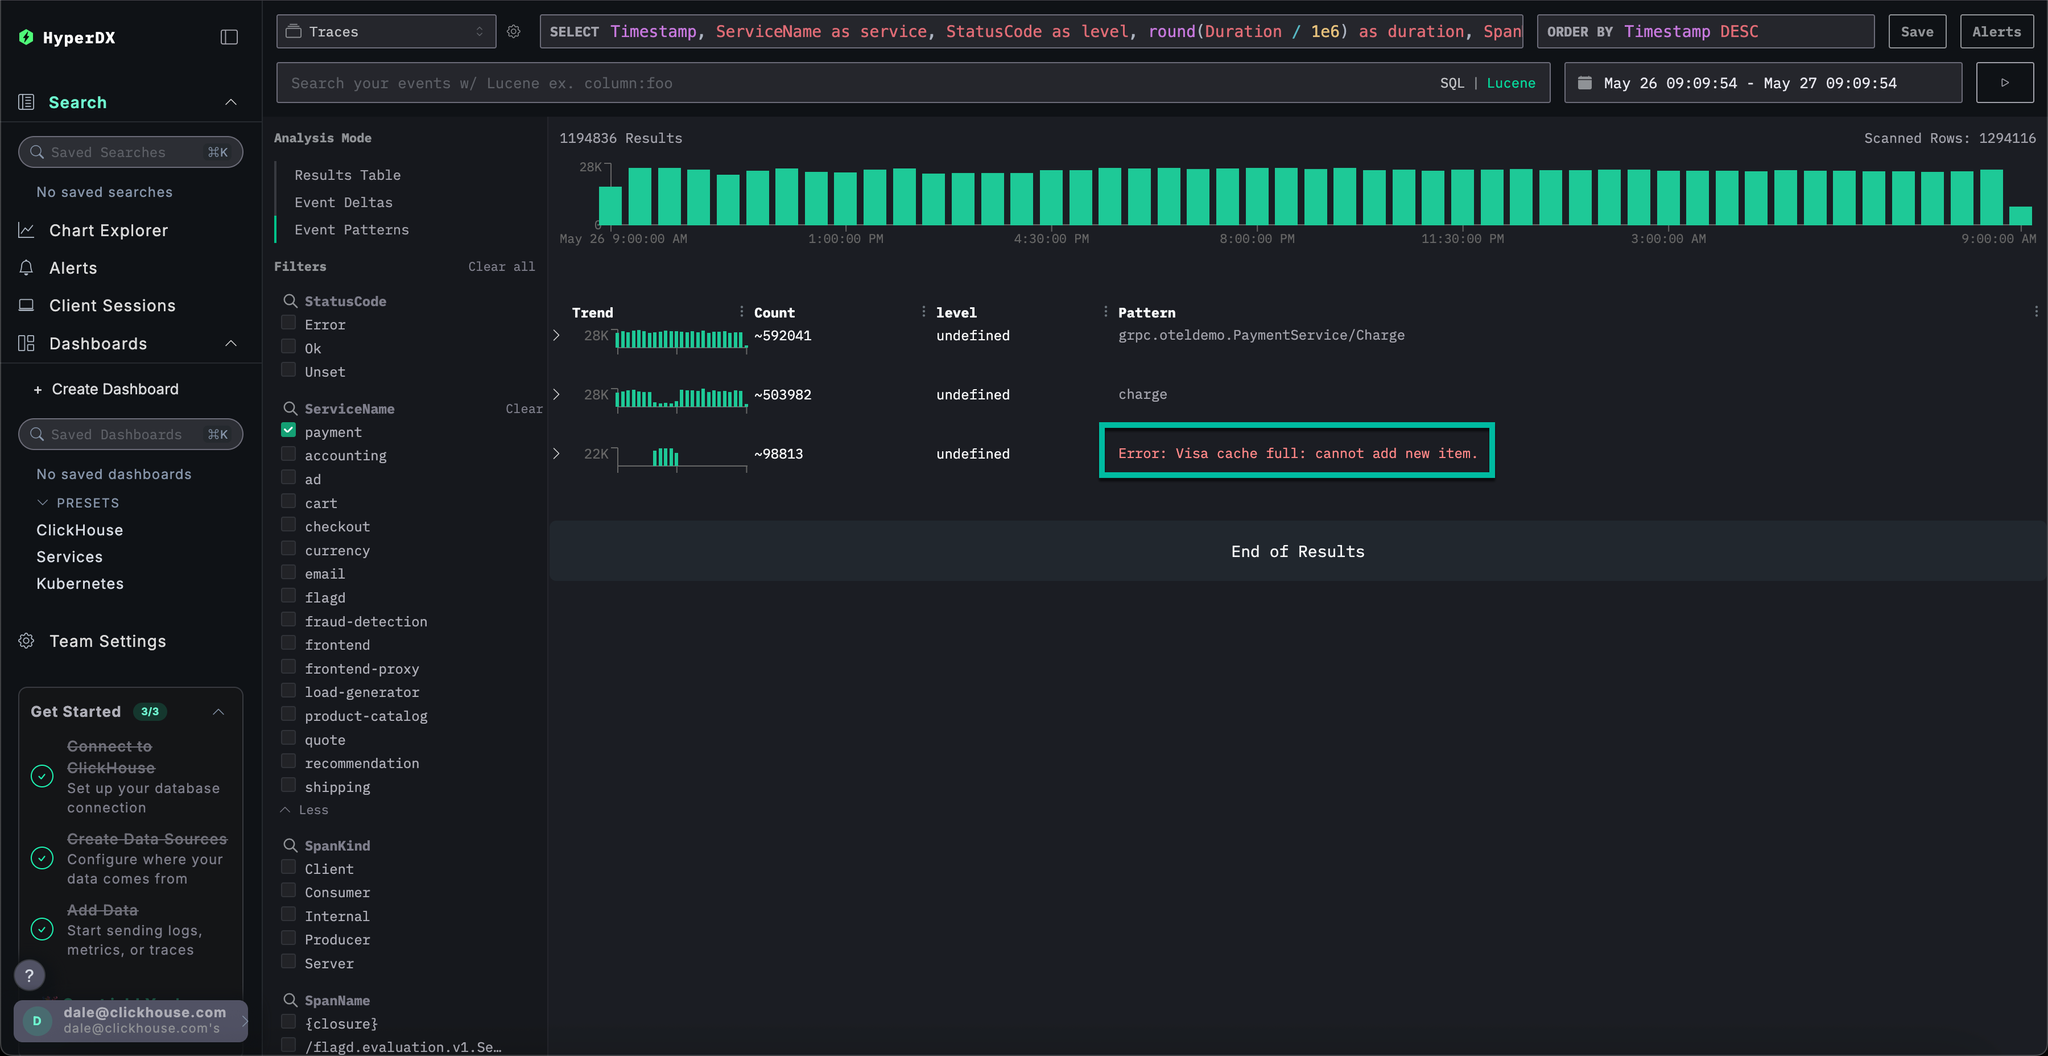
If we apply event clustering to the traces by selecting Event Patterns, we can immediately see our cache issue with the payment service.
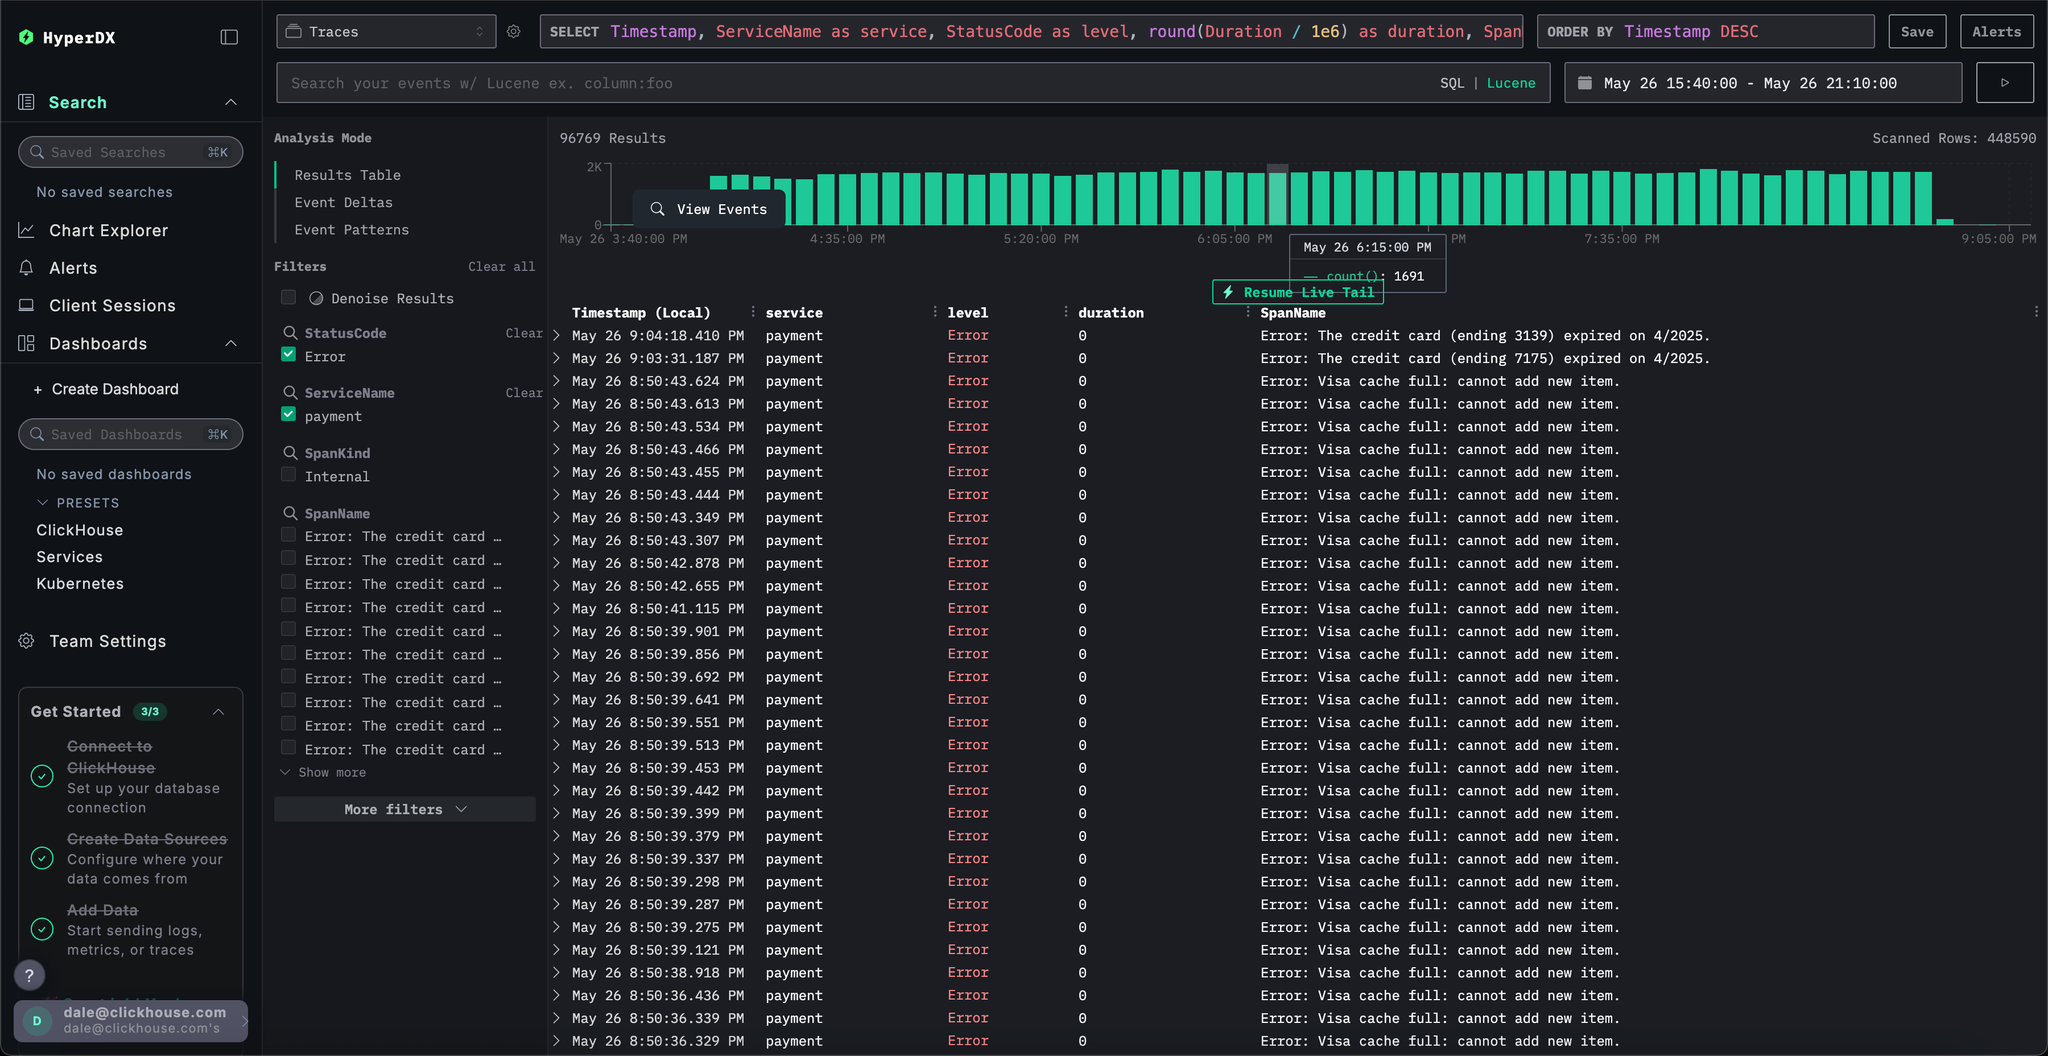
Switch to the results view by clicking on Results table. Filter to errors using the StatusCode filter and Error value.
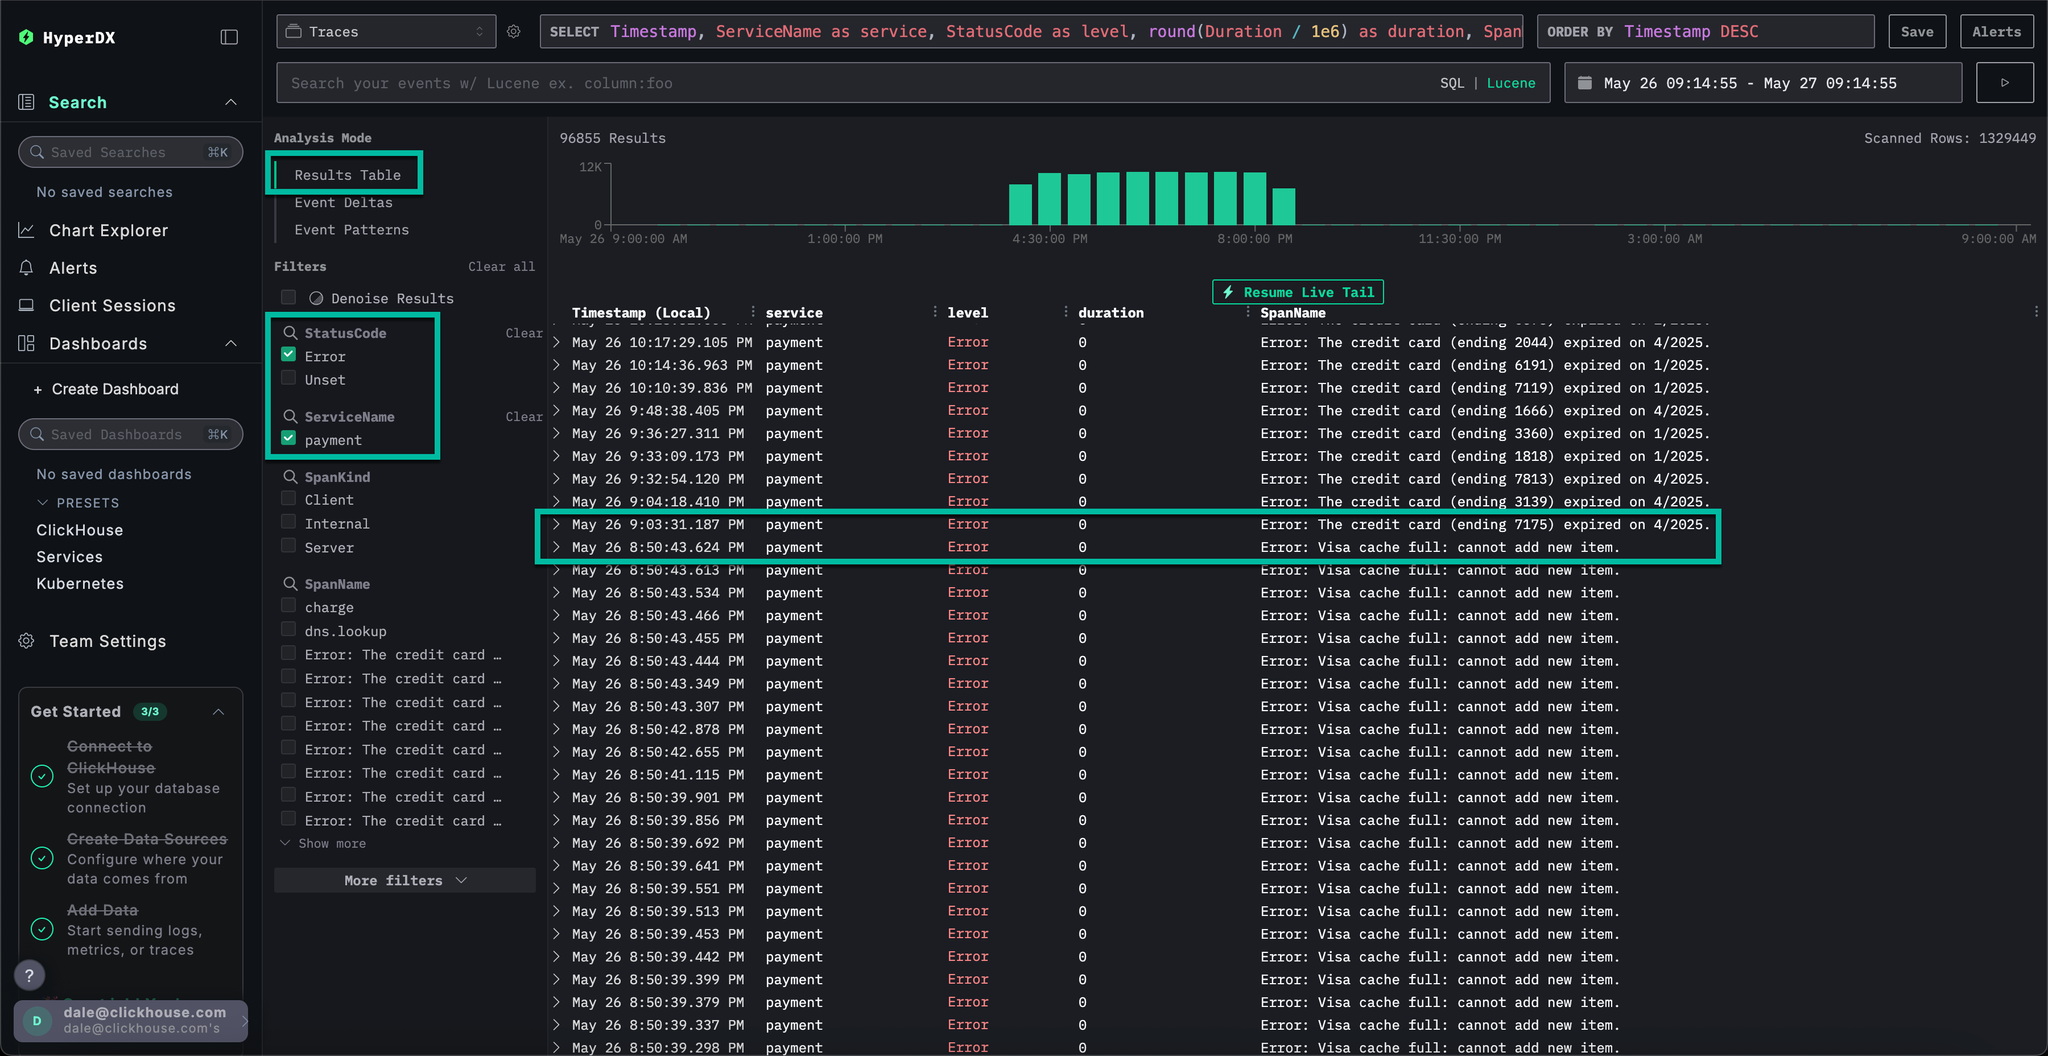
Select a Error: Visa cache full: cannot add new item. error, switch to the Infrastructure tab and widen the timespan to 1d.
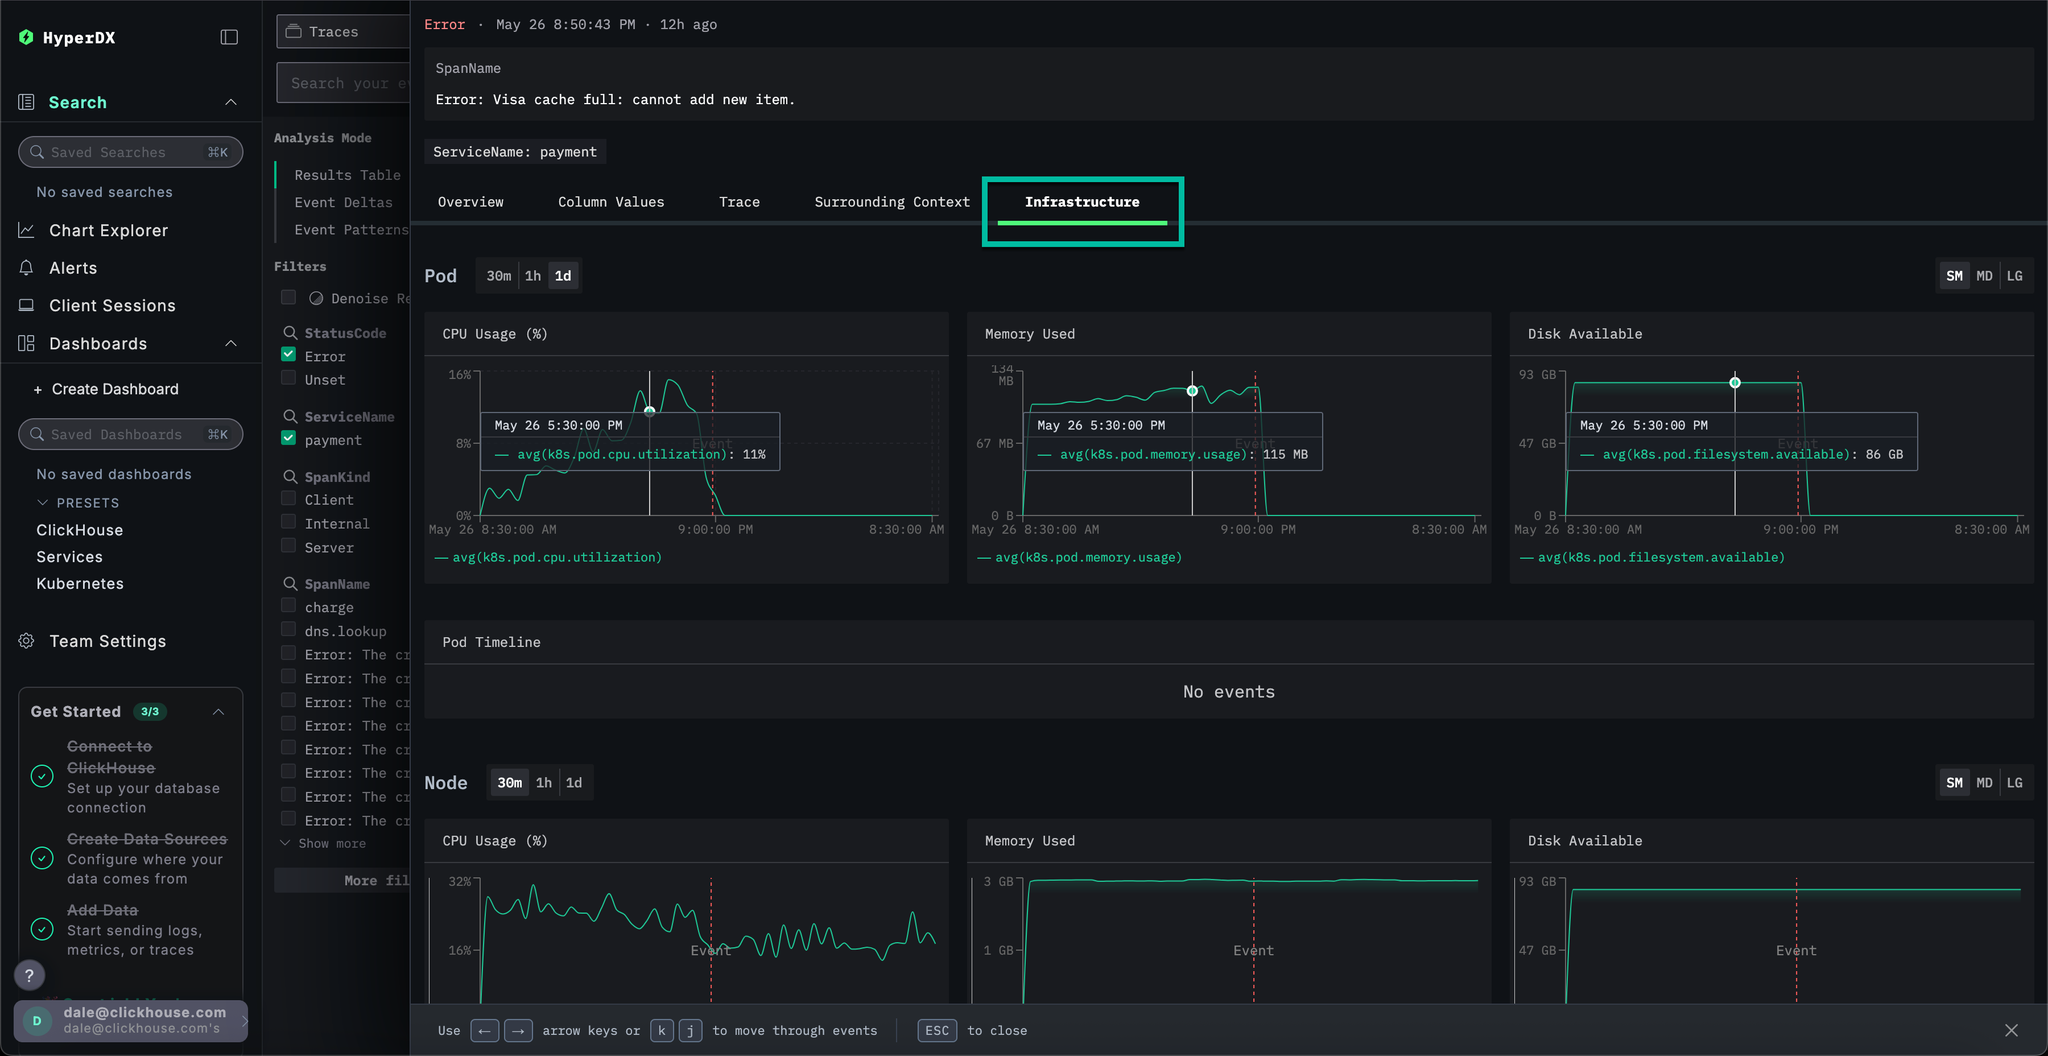
By correlating traces with metrics we can see that memory and CPU increased with the payment service, before collapsing to 0 (we can attribute this to a pod restart) - suggesting the cache issue caused resource issues. We can expect this has impacted payment completion times.
Event Deltas help surface anomalies by attributing changes in performance or error rates to specific subsets of data—making it easier to quickly pinpoint the root cause.
While we know that the payment service has a cache issue, causing an increase in resource consumption, we haven't fully identified the root cause.
Return to the result table view and select the time period containing the errors to limit the data. Ensure you select several hours to the left of the errors and after if possible (the issue may still be occurring):
Remove the errors filter and select Event Deltas from the left Analysis Mode menu.
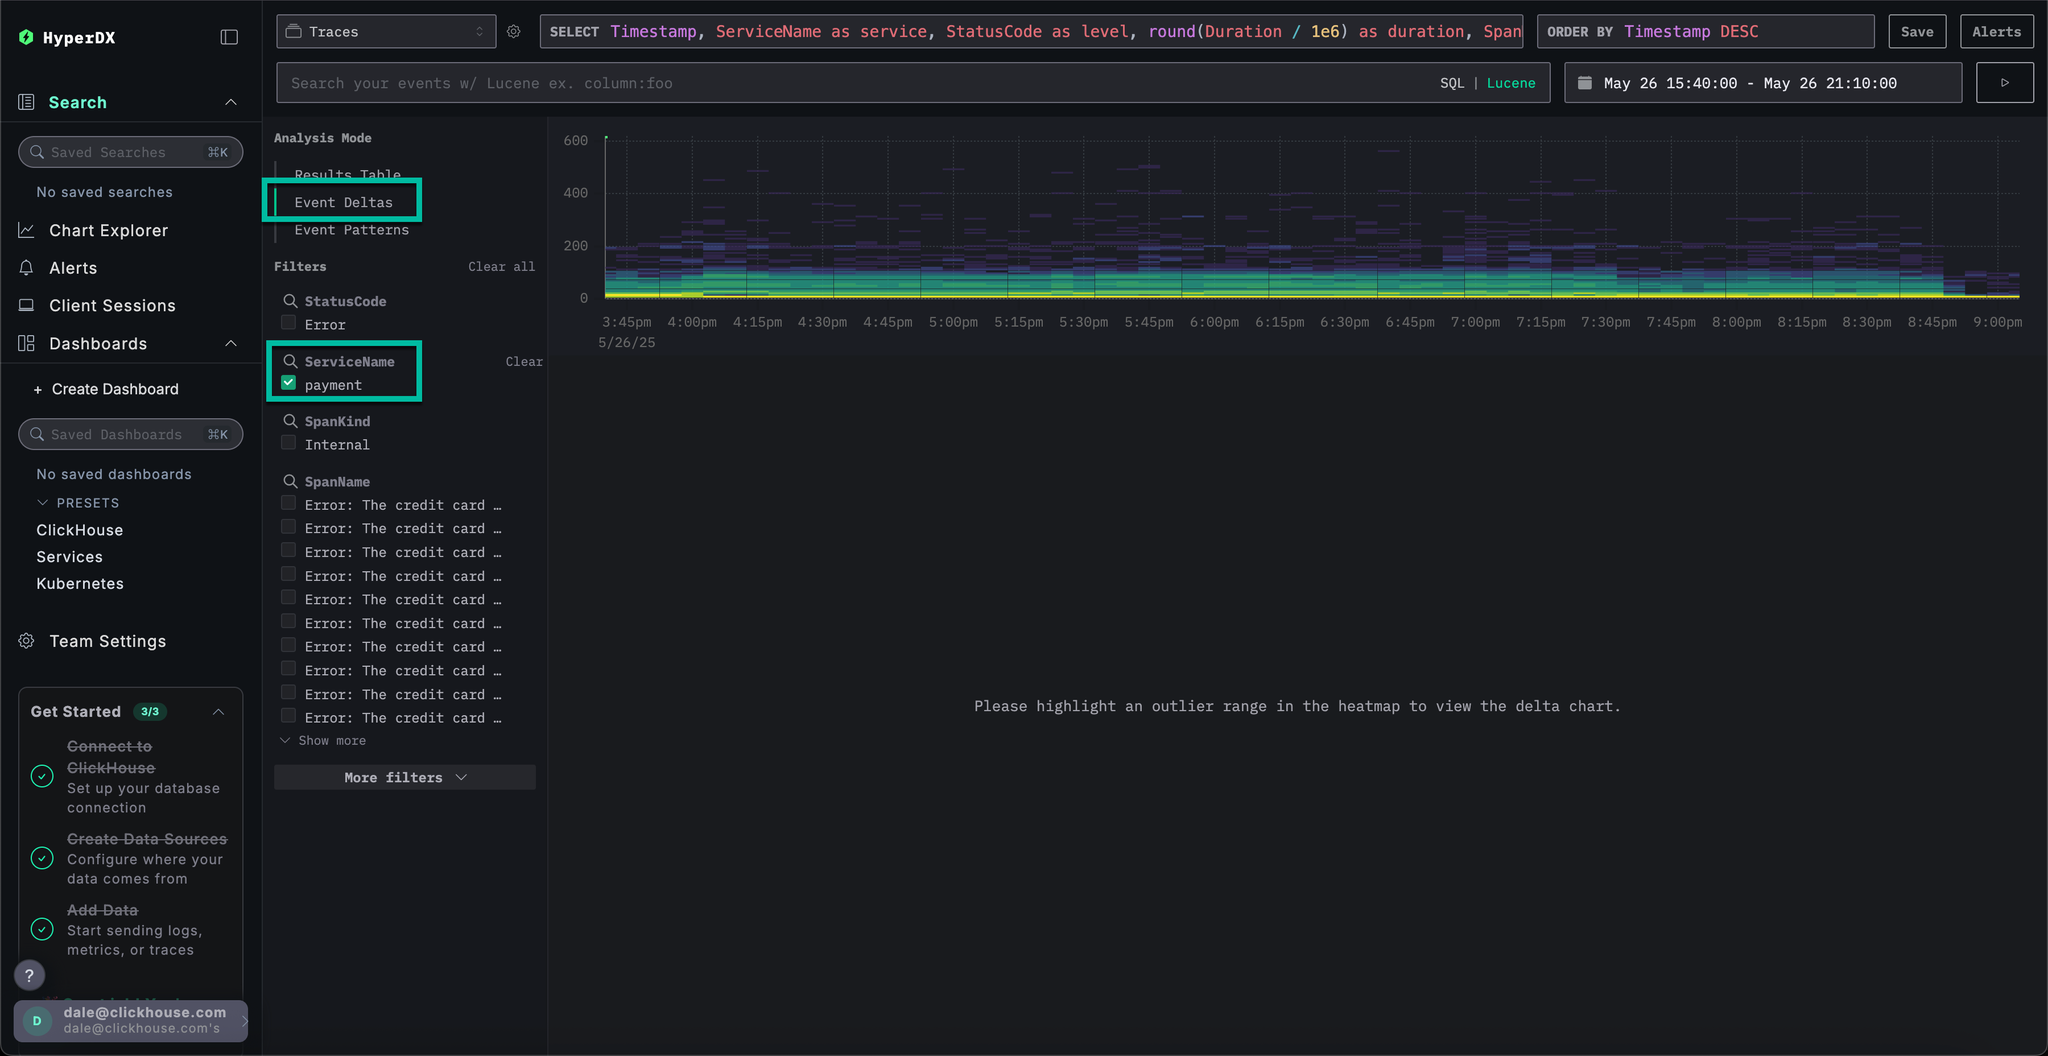
The top panel shows the distribution of timings, with colors indicating event density (number of spans). The subset of events outside of the main concentration are typically those worth investigating.
If we select the events with a duration greater than 200ms, and apply the filter Filter by selection, we can limit our analysis to slower events:
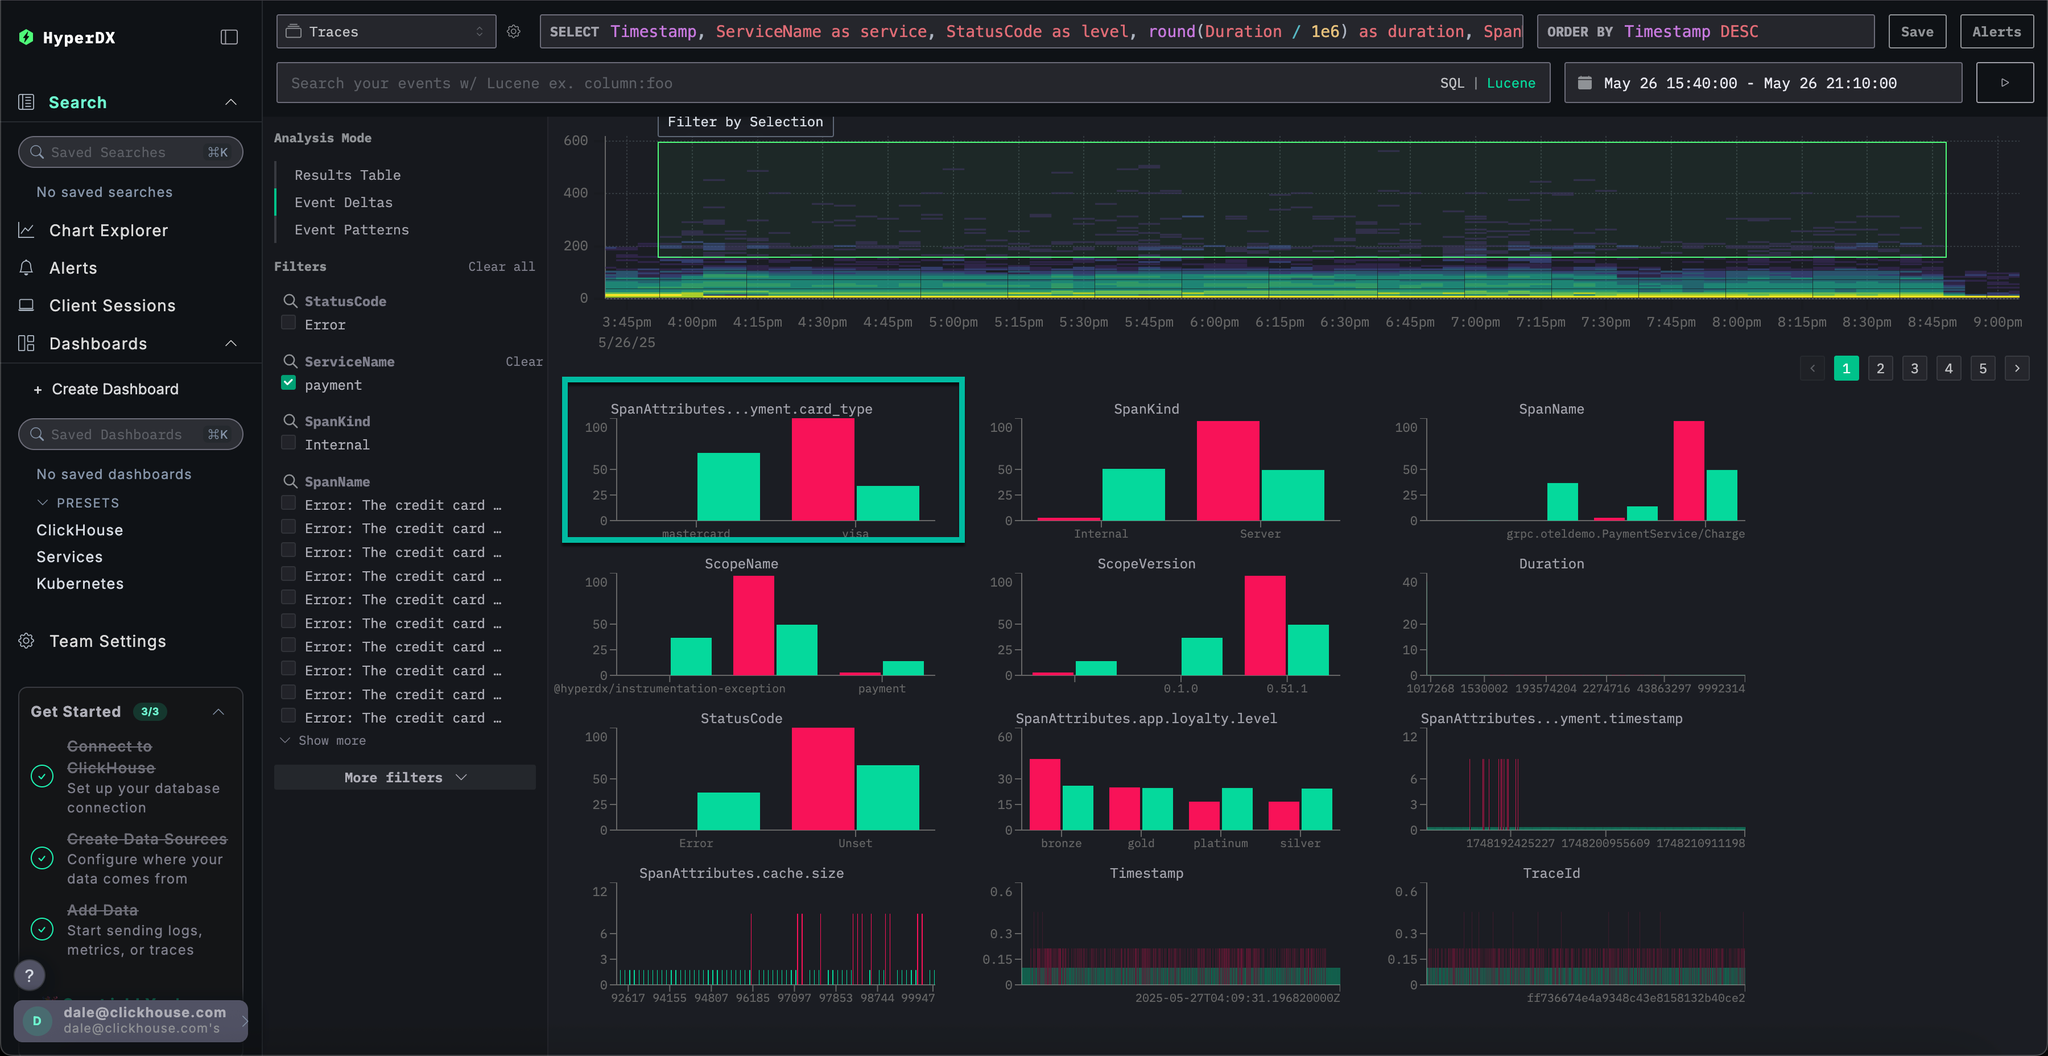
With analysis performed on the subset of data, we can see most performance spikes are associated with visa transactions.
In ClickStack, we can chart any numeric value from logs, traces, or metrics for greater context.
We have established:
- Our issue resides with the payment service
- A cache is full
- This caused increases in resource consumption
- The issue prevented visa payments from completing - or at least causing them to take a long time to complete.
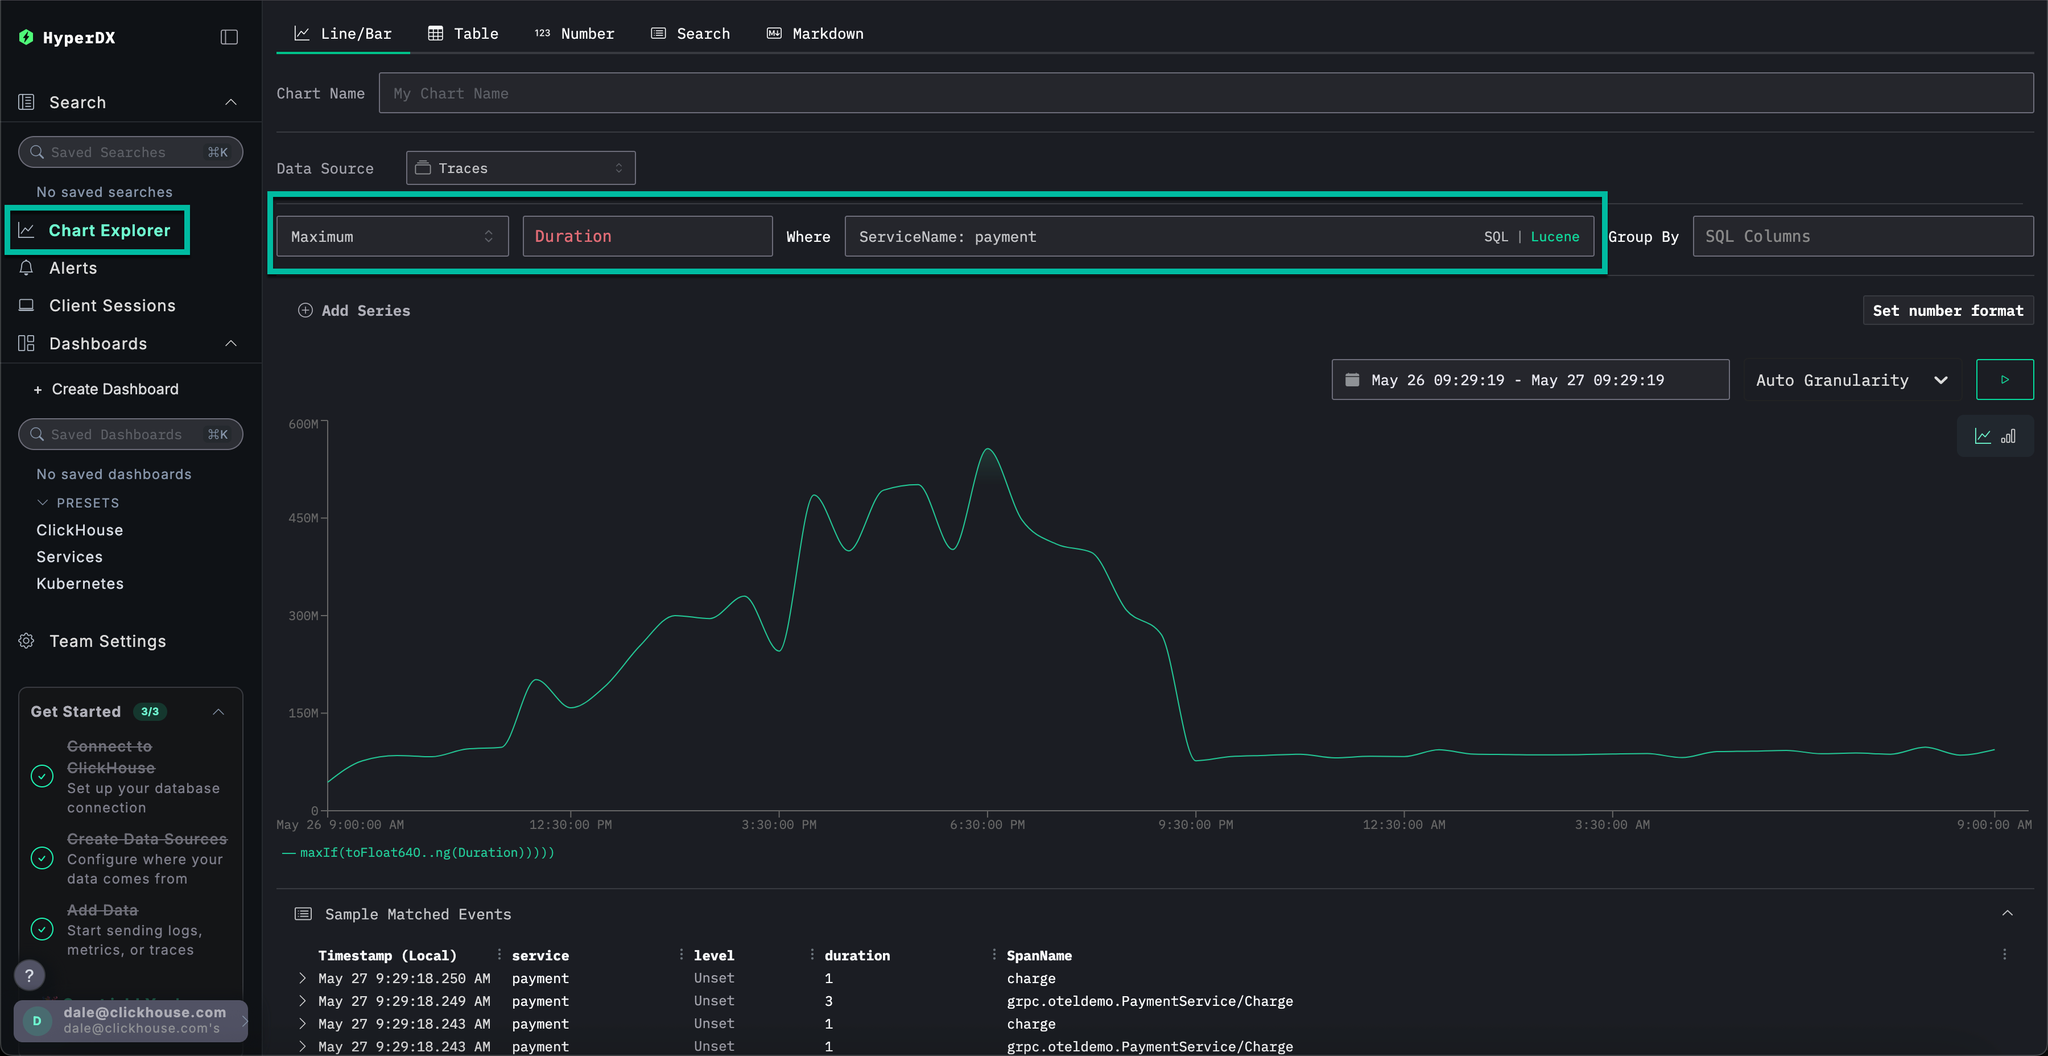
Select Chart Explorer from the left menu. Complete the following values to chart the time taken for payments to complete by chart type:
Data Source:TracesMetric:MaximumSQL Column:DurationWhere:ServiceName: paymentTimespan:Last 1 day
Clicking ▶️ will show how the performance of payments degraded over time.
If we set Group By to SpanAttributes['app.payment.card_type'] (just type card for autocomplete) we can see how the performance of the service degraded for Visa transactions relative to Mastercard:
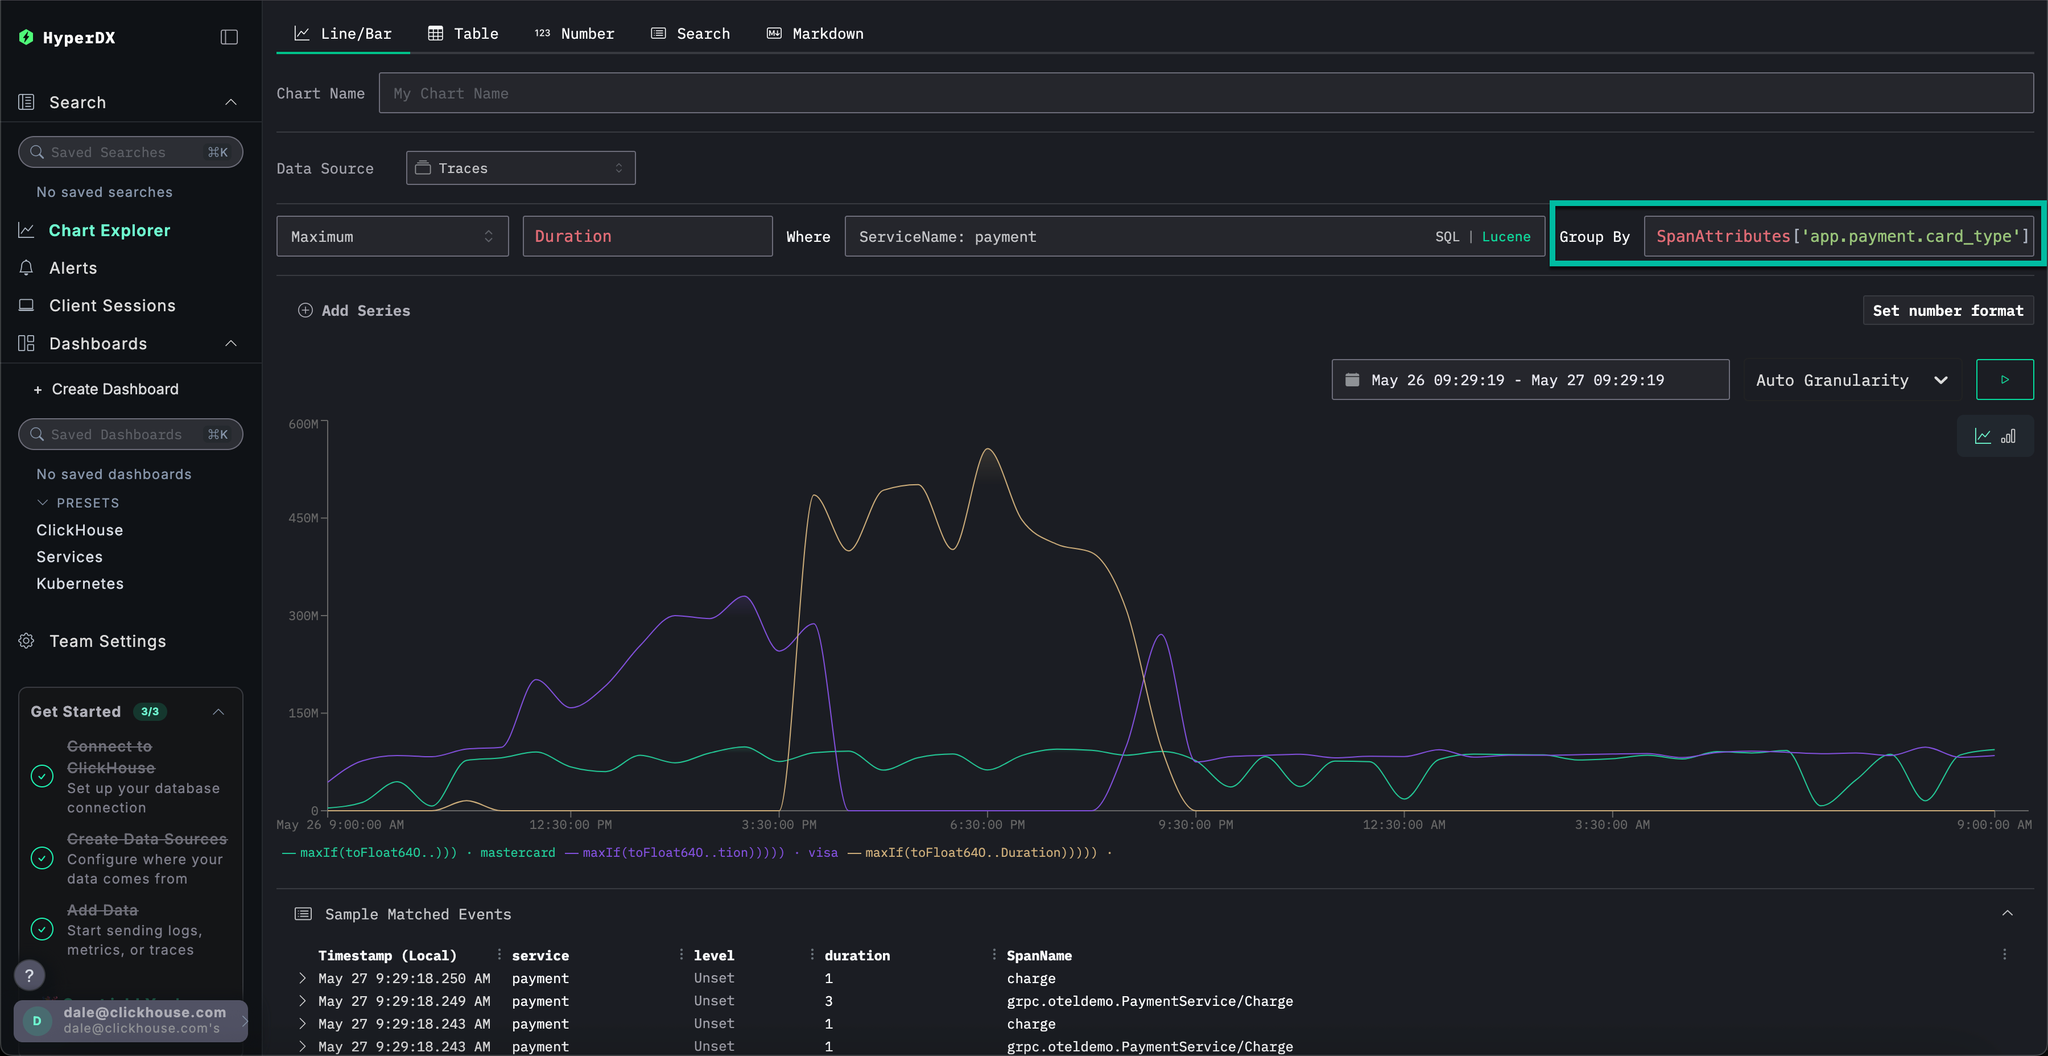
Note than once the error occurs responses return in 0s.
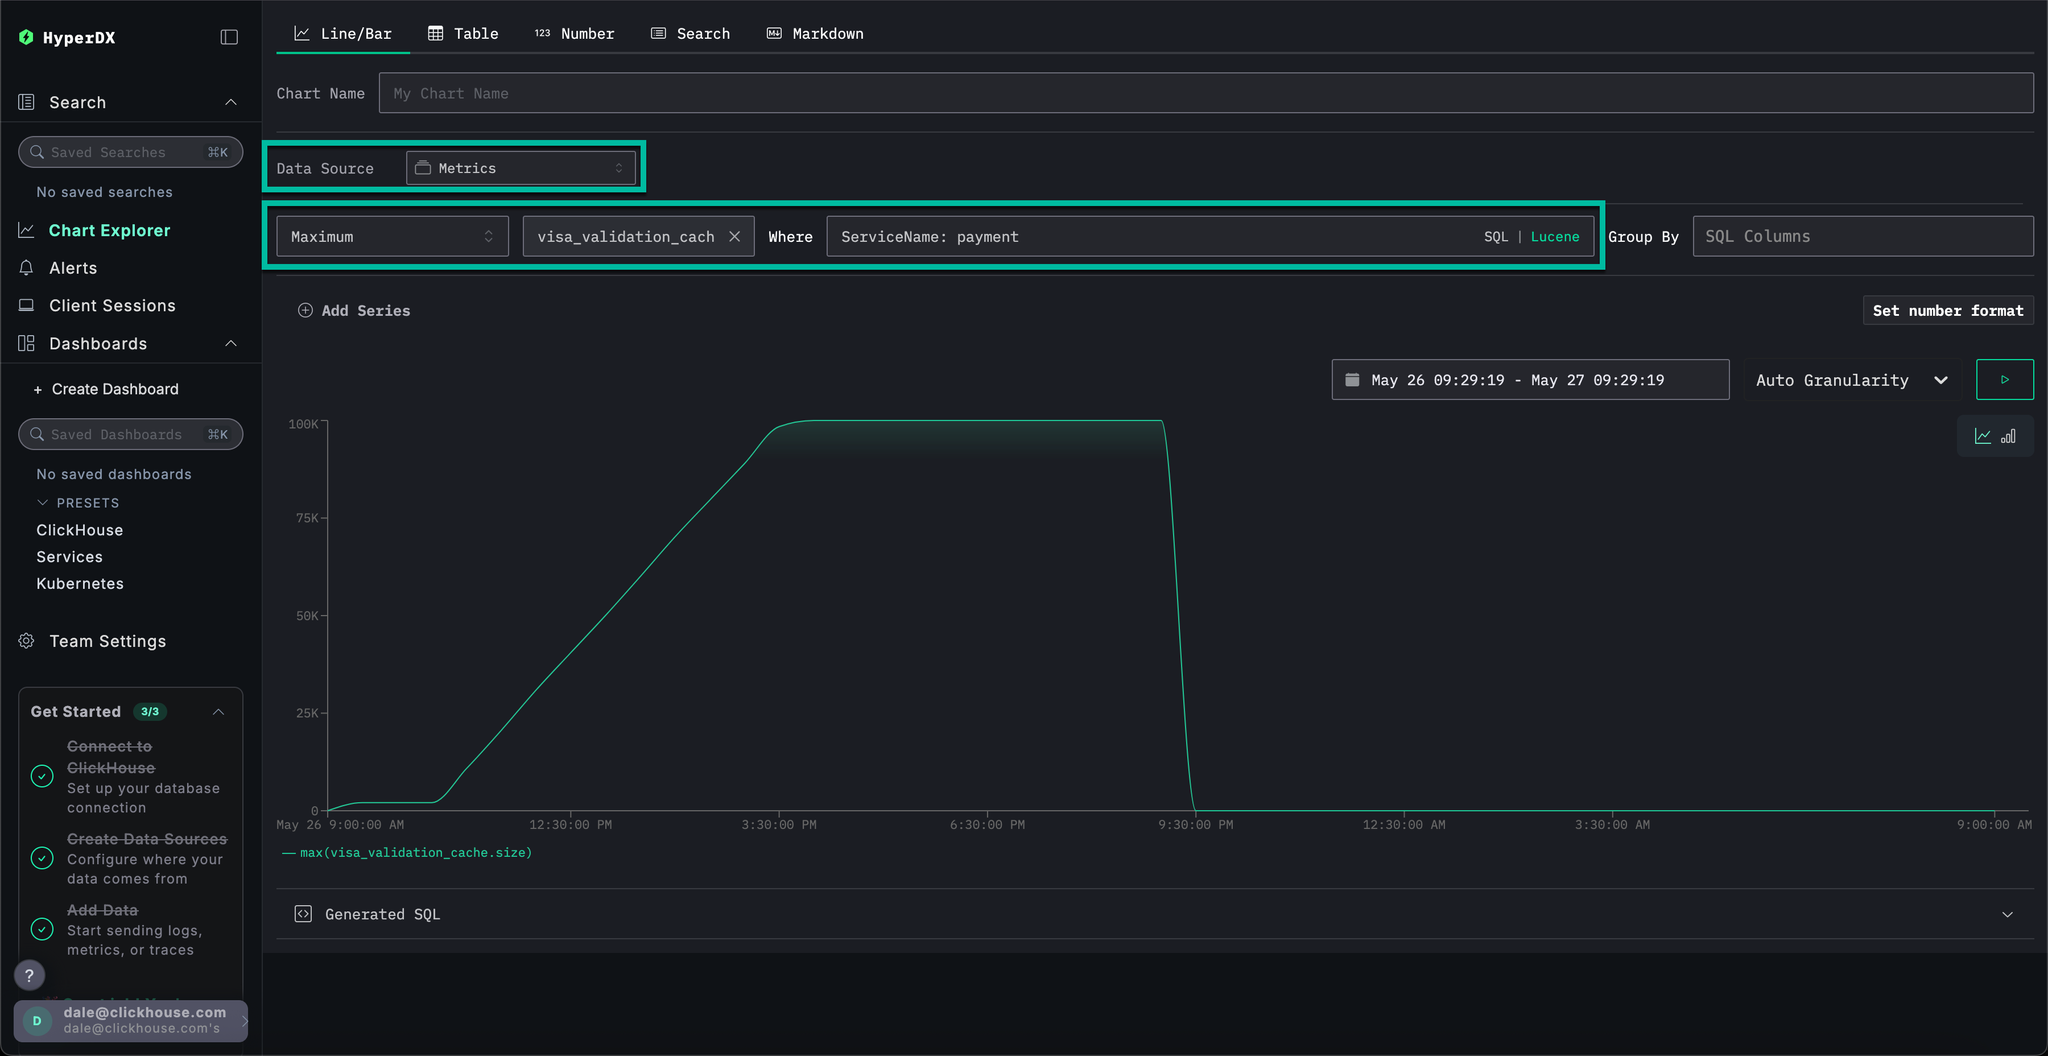
Finally, let's plot the cache size as a metric to see how it behaved over time, thus giving us more context.
Complete the following values:
Data Source:MetricsMetric:MaximumSQL Column:visa_validation_cache.size (gauge)(just typecachefor autocomplete)Where:ServiceName: paymentGroup By:<empty>
We can see how the cache size increased over a 4-5 hr period (likely after a software deployment) before reaching a maximum size of 100,000. From the Sample Matched Events we can see our errors correlate with the cache reaching this limit and, after which it is recorded as having a size of 0 with responses also returning in 0s.
In summary, by exploring logs, traces and finally metrics we have concluded:
- Our issue resides with the payment service
- A change in service behavior, likely due to a deployment, resulted in a slow increase of a visa cache over a 4-5 hr period - reaching a maximum size of
100,000. - This caused increases in resource consumption as the cache grew in size - likely due to a poor implementation
- As the cache grew, the performance of Visa payments degraded
- On reaching the maximum size, the cache rejected payments and reported itself as size
0.
Sessions allow us to replay the user experience, offering a visual account of how an error occurred from the user's perspective. While not typically used to diagnose root causes, they are valuable for confirming issues reported to customer support and can serve as a starting point for deeper investigation.
In HyperDX, sessions are linked to traces and logs, providing a complete view of the underlying cause.
For example, if the support team provides the email of a user who encountered a payment issue Braulio.Roberts23@hotmail.com - it's often more effective to begin with their session rather than directly searching logs or traces.
Navigate to the Client Sessions tab from the left menu before ensuring the data source is set to Sessions and the time period is set to the Last 1 day:
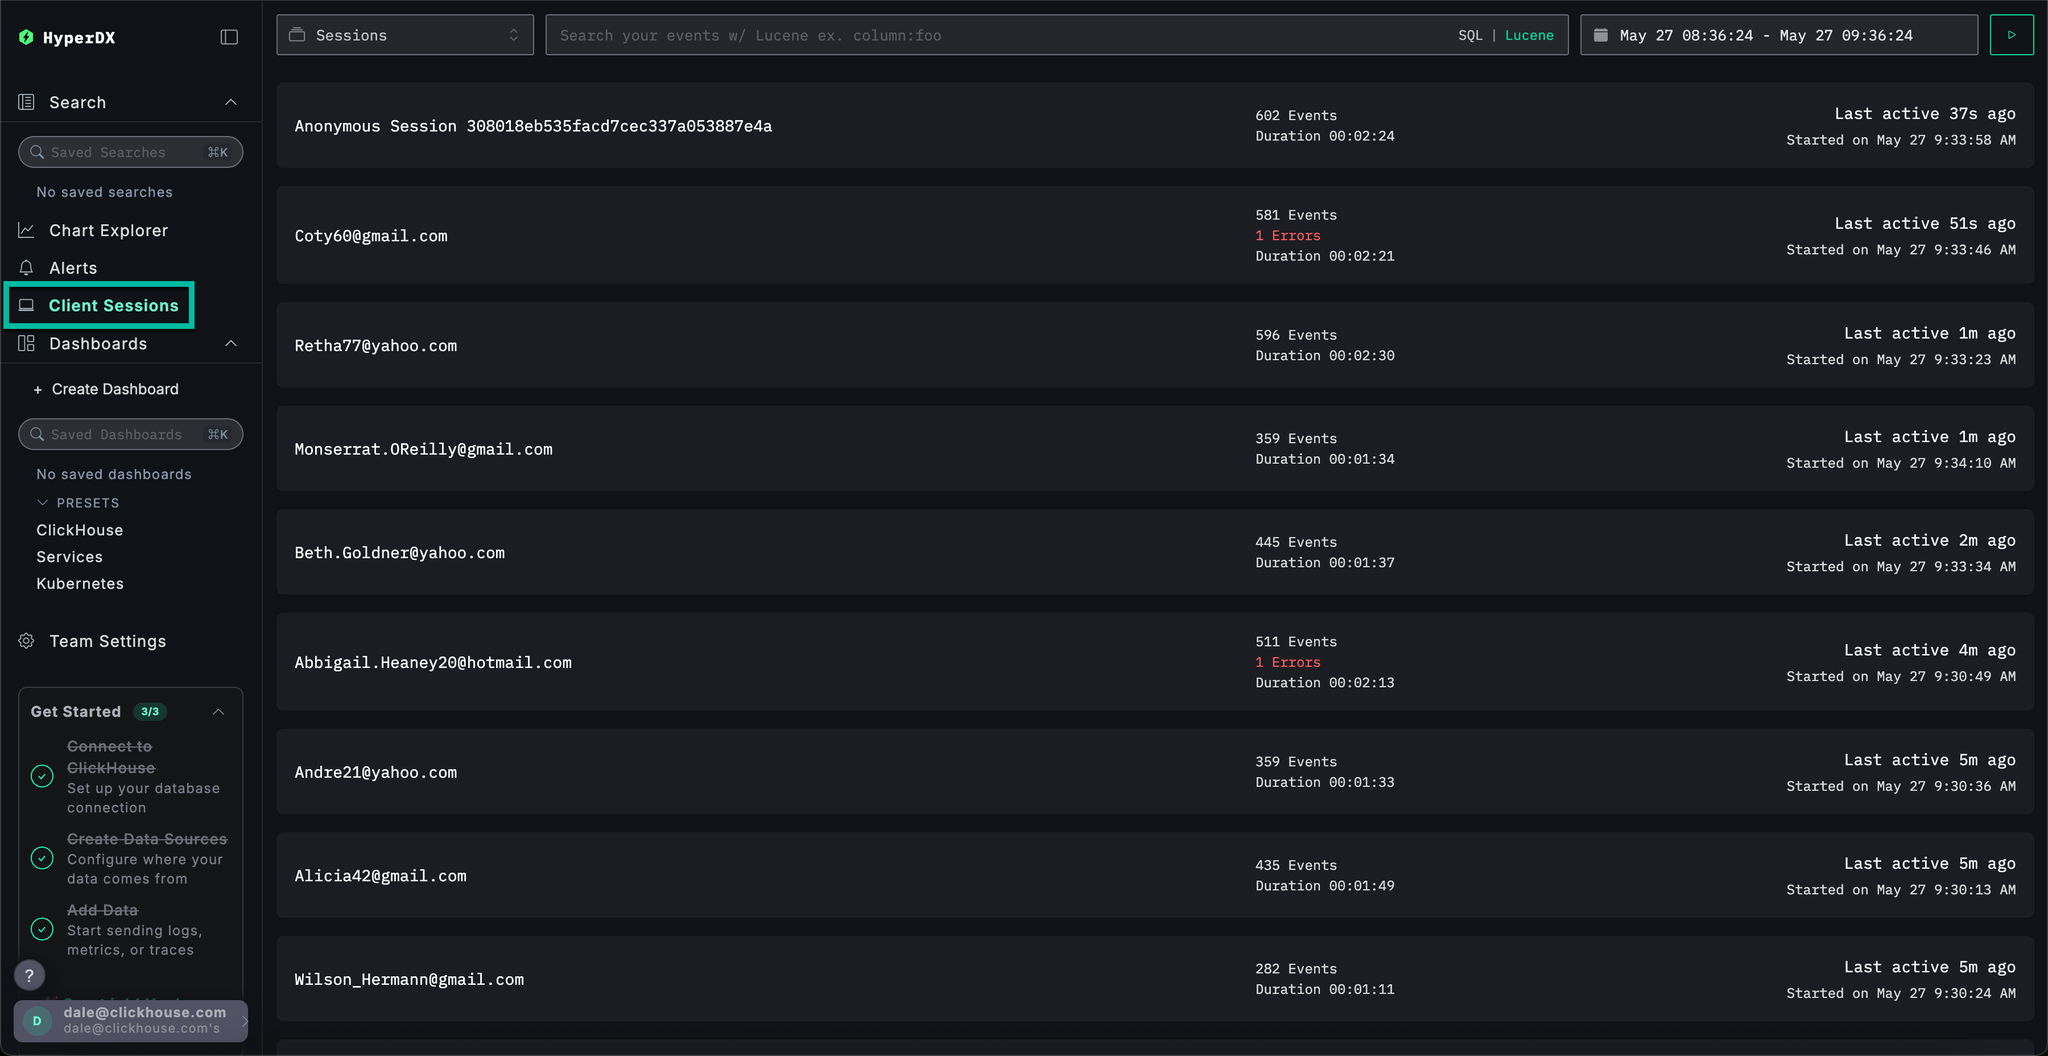
Search for SpanAttributes.userEmail: Braulio to find our customer's session. Selecting the session will show the browser events and associated spans for the customer's session on the left, with the user's browser experience re-rendered to the right:
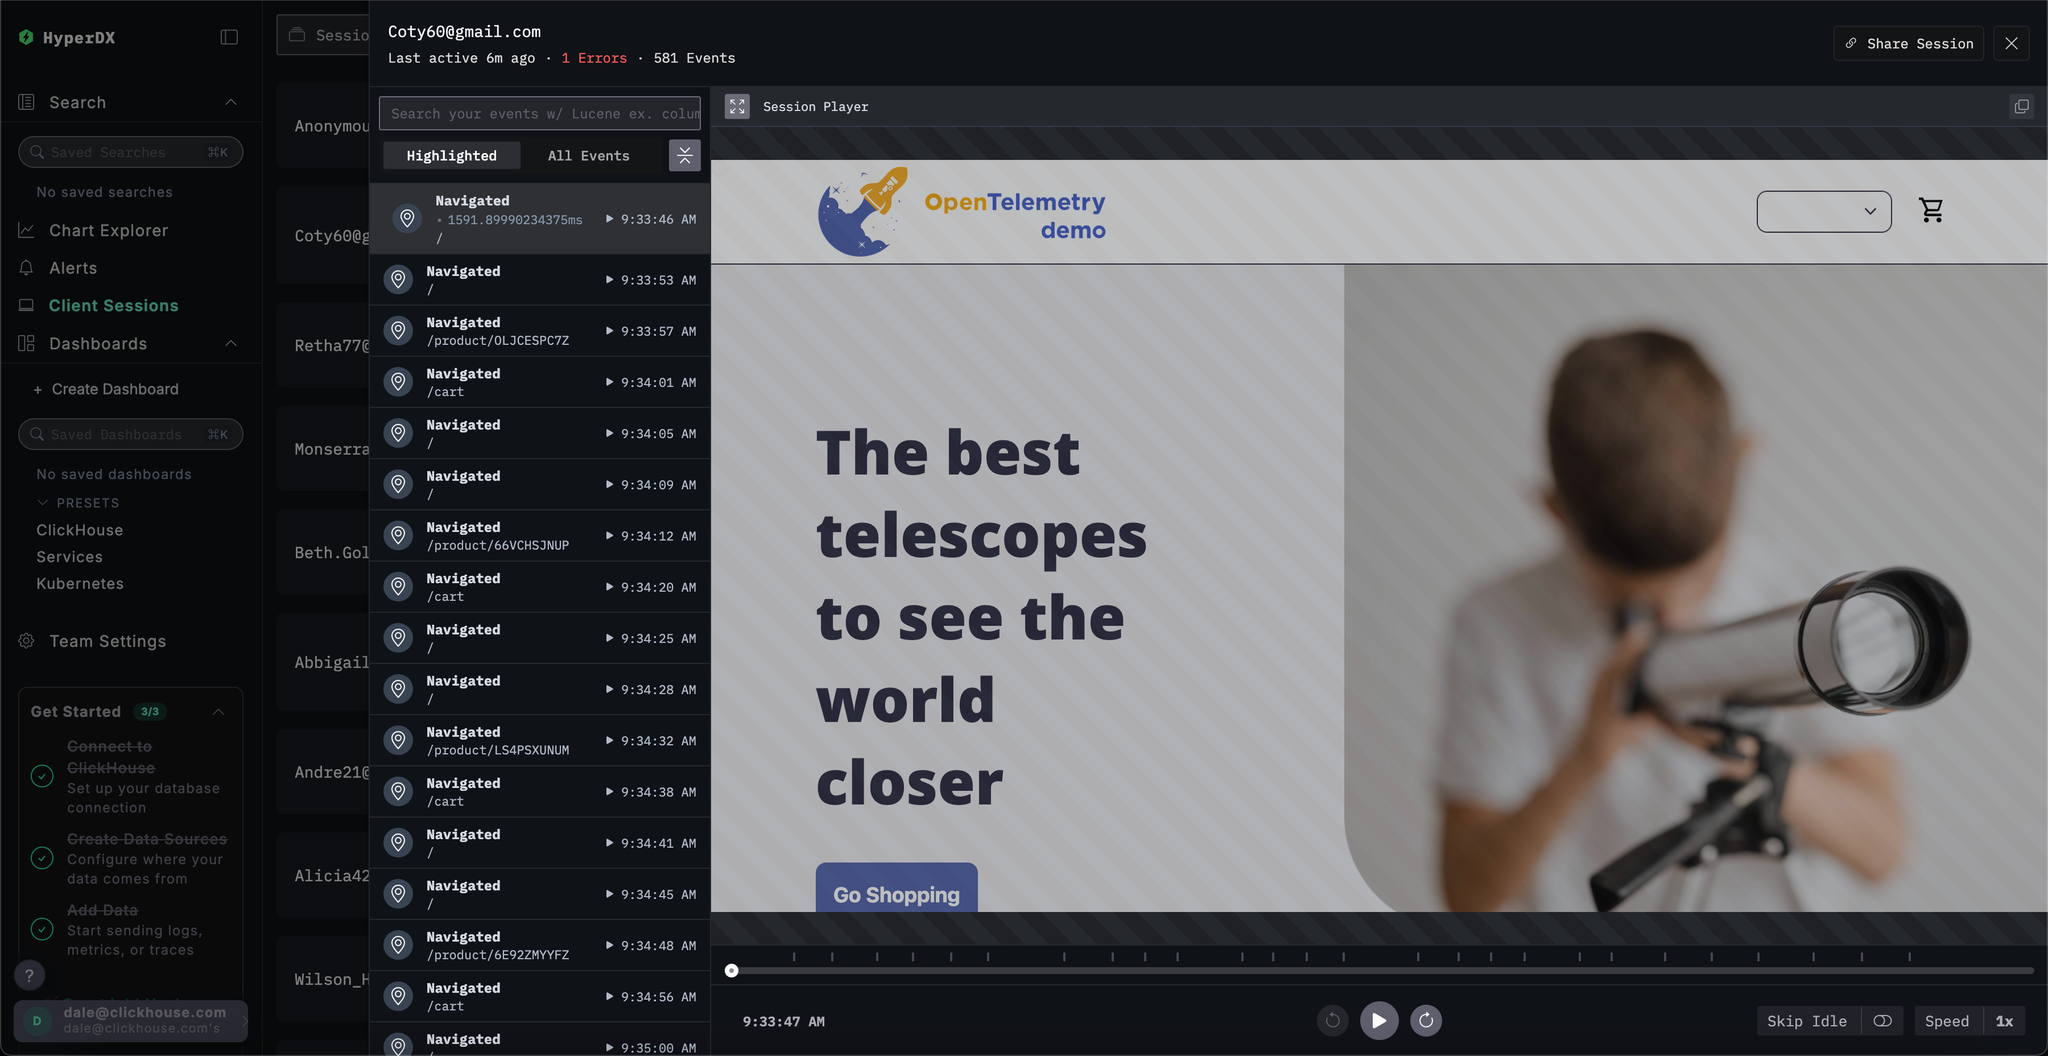
Sessions can be replayed by pressing the ▶️ button. Switching between Highlighted and All Events allows varying degrees of span granularity, with the former highlighting key events and errors.
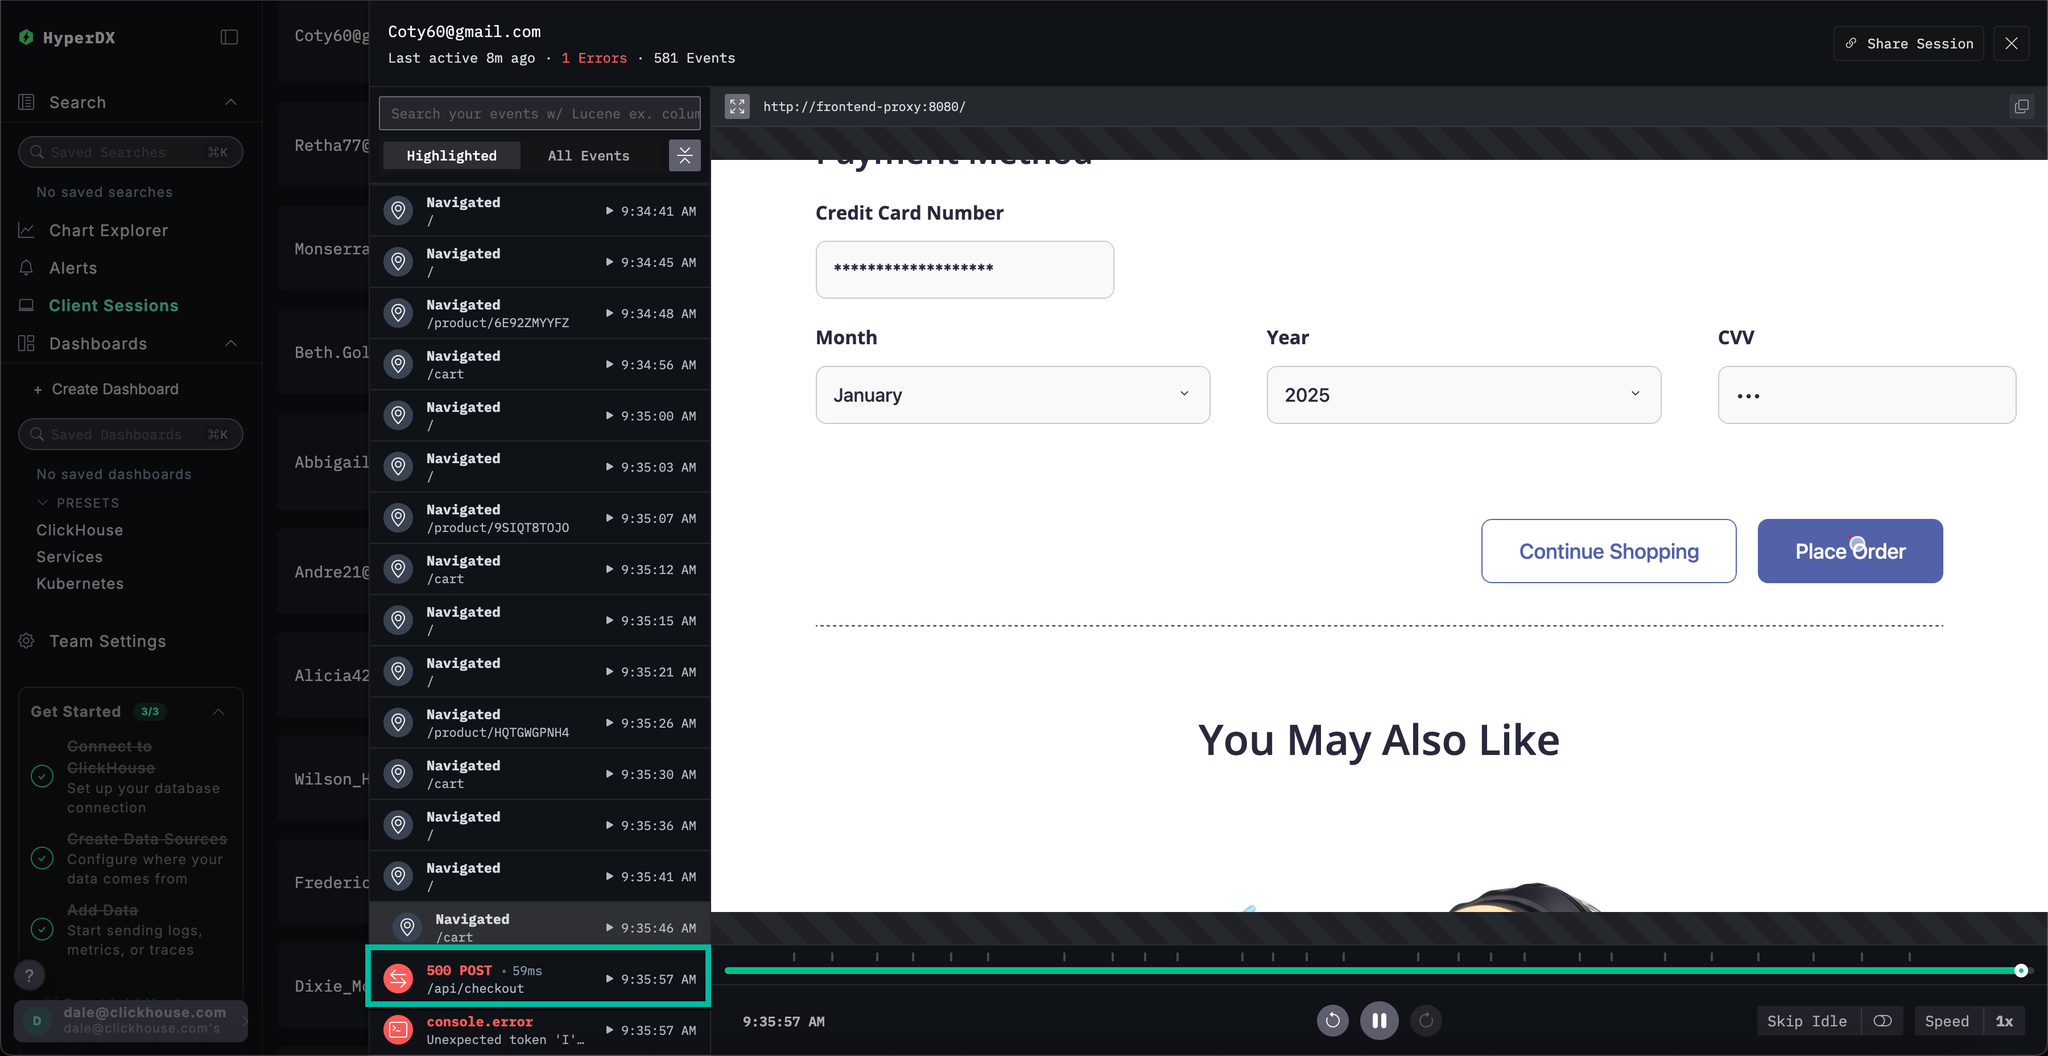
If we scroll to the bottom of the spans we can see a 500 error associated with /api/checkout. Selecting the ▶️ button for this specific span moves the replay to this point in the session, allowing us to confirm the customer's experience - payment seems to simply not work with no error rendered.
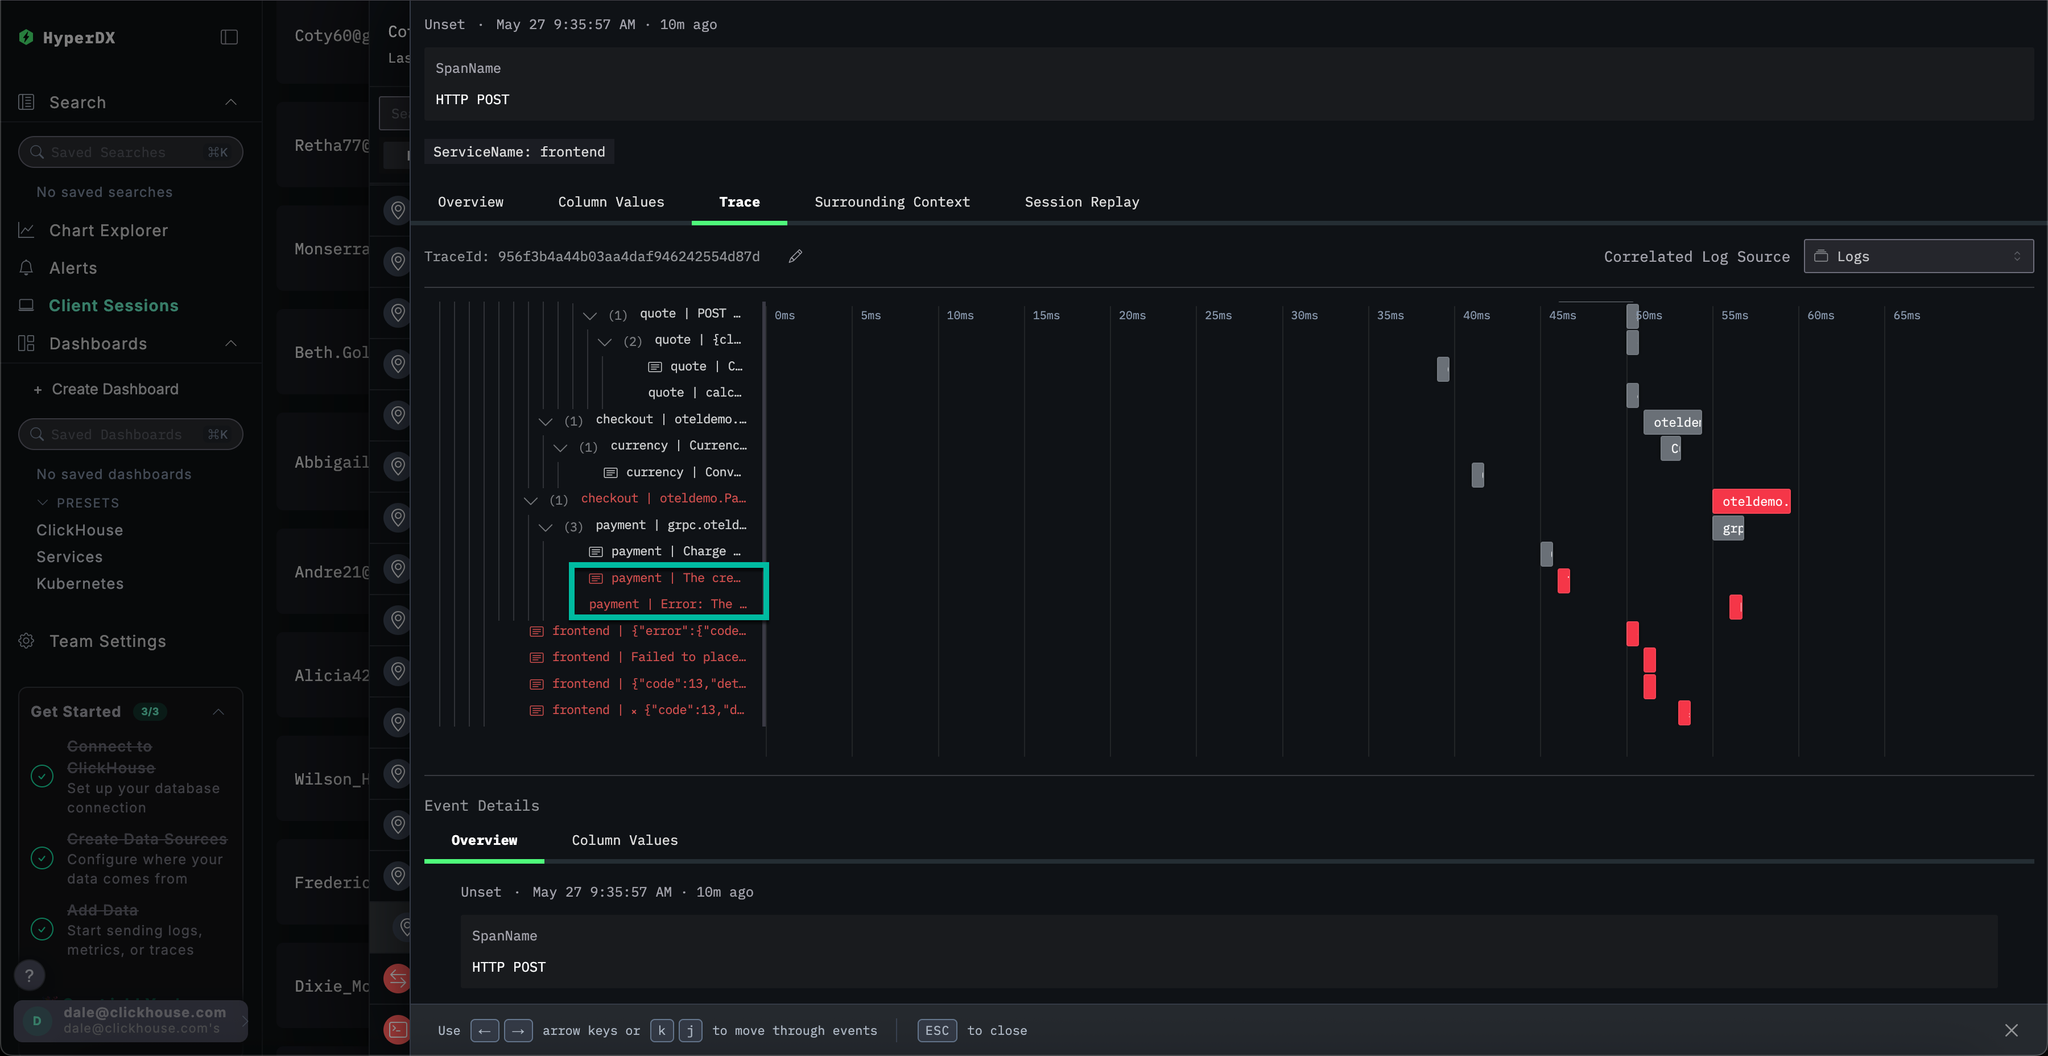
Selecting the span we can confirm this was caused by an internal error. By clicking the Trace tab and scrolling though the connected spans, we are able to confirm the customer indeed was a victim of our cache issue.
This demo walks through a real-world incident involving failed payments in an e-commerce app, showing how ClickStack helps uncover root causes through unified logs, traces, metrics, and session replays - explore our other getting started guides to dive deeper into specific features.
